

A wedge chart pattern is formed when two trend lines converge. It denotes that the size of the price movement within the wedge pattern is reducing.
Wedges represent a break in the current trend. If you see this pattern, it means that traders are still debating where to take the pair next.
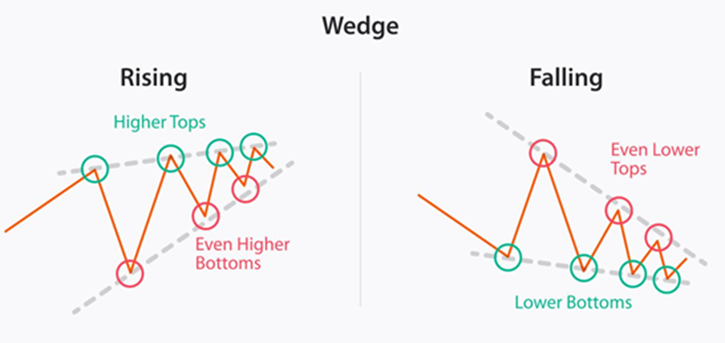
A rising wedge is found in a downtrend and signifies a bearish reversal. Falling wedges occur in an uptrend and indicate a bullish reversal.
Depending upon where they are found on a price chart, wedges can be interpreted either as a reversal or continuation pattern and can help traders find trading opportunities.
This article explains the falling wedge pattern in detail as well as the technical approach to trading this pattern.
What is a Falling Wedge Pattern?
The falling wedge pattern, also known as the descending wedge pattern, is a bullish formation that can appear in both trend continuation and trend reversal situations. It indicates a trend continuation during an established uptrend or a bullish reversal after a downward trend.
The falling wedge develops when the price of an asset declines, however, the range of price movements begins to narrow. The buyers absorb the selling pressure completely and gather their strength before starting to drive the market higher as the wedge formation contracts toward the end. A falling wedge pattern denotes the conclusion of a price correction and an upward turn.
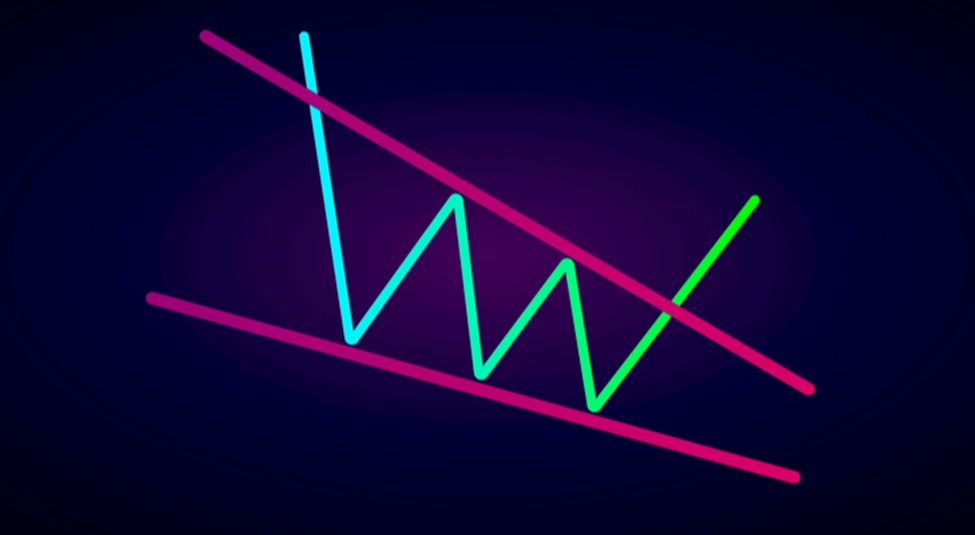
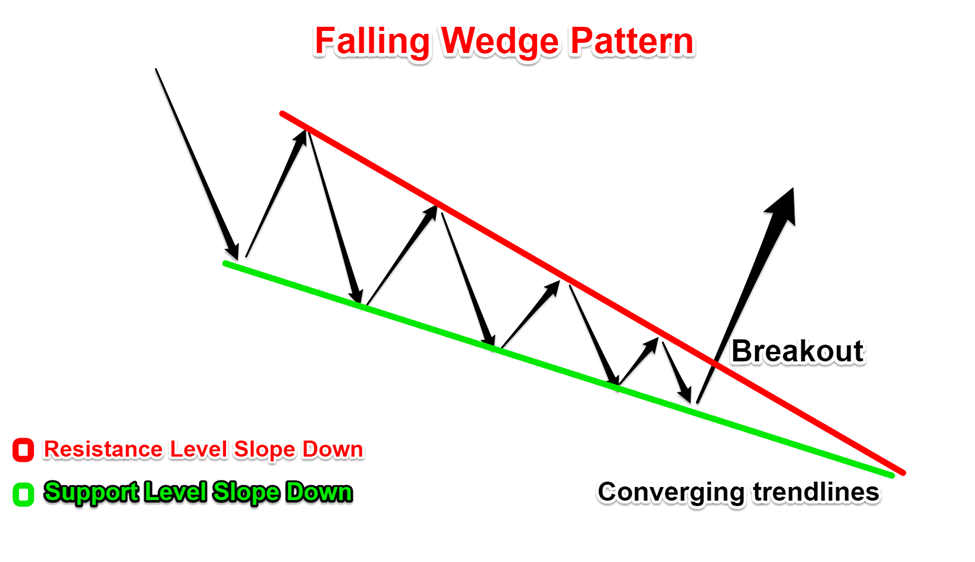
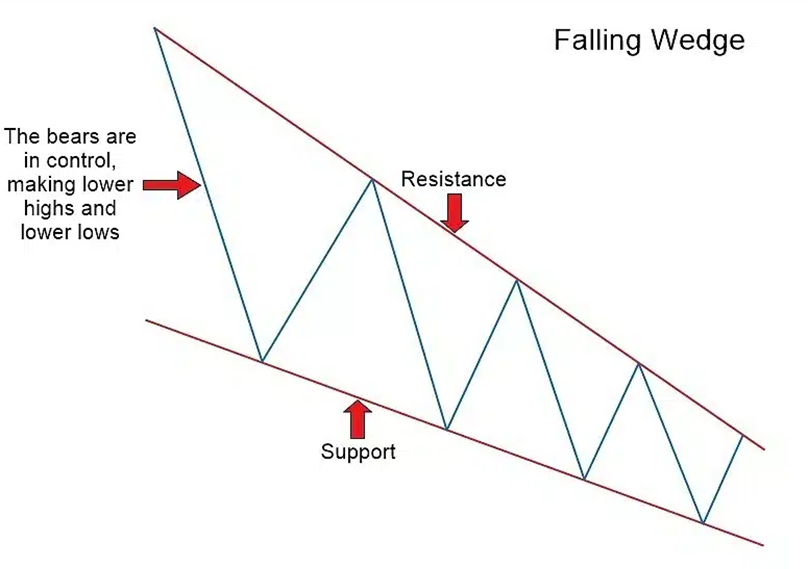
A falling wedge pattern can also be defined by a sequence of lower lows (support) and lower highs (resistance) that slope downward and narrow into a smaller range before the price ultimately breaks above the resistance line and the trend direction changes.
Much like the rising chart pattern, the falling wedge is a valuable chart pattern, which can be seen regularly in any financial instrument and over any time frame. The pattern is frequently seen by forex traders as a price consolidation mode and a momentum indicator that is slowing down.
When the falling wedge breakout happens, there is a buying opportunity and a possible indication of a trend reversal.
Falling Wedge Pattern: Explained
The falling wedge appears when the asset’s price moves in an overall bullish trend just before the price movement corrects lower. Two converging trend lines are drawn within this pullback. Once the price movement breaks through the resistance of the upper trend line, or wedge, the consolidation phase is over.
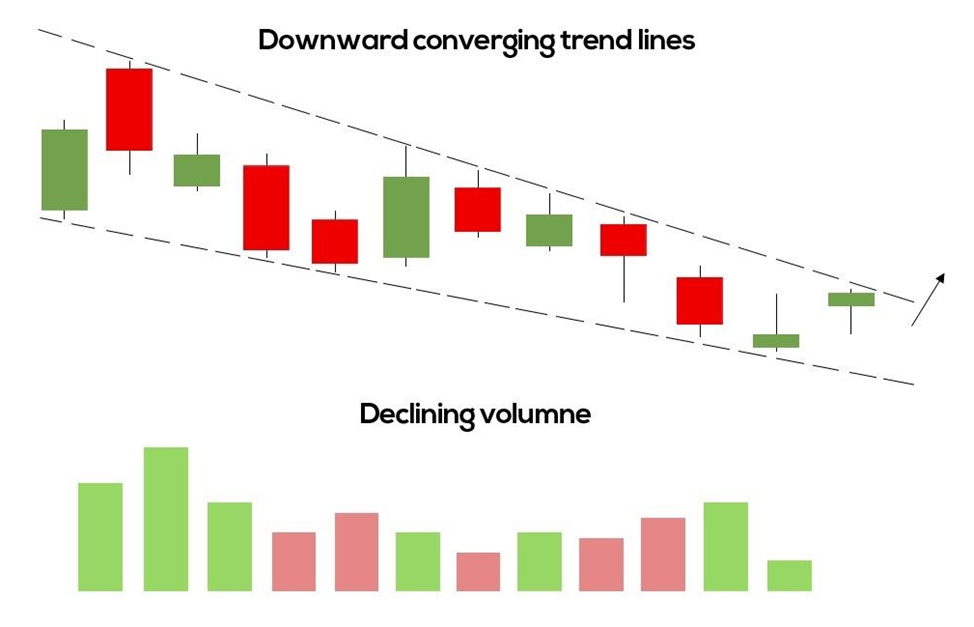
Volume is one of the key features of falling wedges. It ideally decreases as the pattern converges and increases as the breakout above the upper trend line occurs, representing a change in momentum toward the buyers.
Hence the falling wedge patterns have the following key features:
- Price Action: The price action trades lower, creating lower lows and lower highs.
- Trend lines: There are two converging trend lines. One connects the lower lows, and the other connects the lower highs. They eventually intersect on a converging point called the apex. At least two spots should be connected by each line. However, the higher the number, the greater the likelihood of a market reversal.
- Volume: Volume decreases as the channel progresses.
- Contraction: The range’s contraction indicates decreasing market volatility. As the pattern matures, new lows contract because the selling pressure reduces. As a result, the lower line serves as support, and the price consolidation within the narrowing range form a coiled spring effect, eventually resulting in a sharp move on the upper side. The price breaks over the upper trend line resistance, showing that buyers are gaining momentum and sellers are losing control, leading to an upward move.
The first two features of a falling wedge must exist, but the third feature, a decrease in volume, is extremely beneficial because it lends the pattern more credibility and veracity.
Identifying a falling wedge that satisfies all three requirements could take some time.
Spotting the Falling Wedges
The most typical falling wedge pattern appears during a clear uptrend. The price movement continues to move upward, but at a certain point, the buyers lose momentum, and the bears temporarily seize control over the price action.
The second phase occurs when the consolidation phase begins which lowers the price action. It’s critical to understand the distinction between a falling wedge and a descending channel. In a channel, the price action produces a succession of lower lows and lower highs, whereas, in a falling wedge, we do have lower highs, but the lows are recorded at higher values. Because of this, our two trend lines are not parallel.
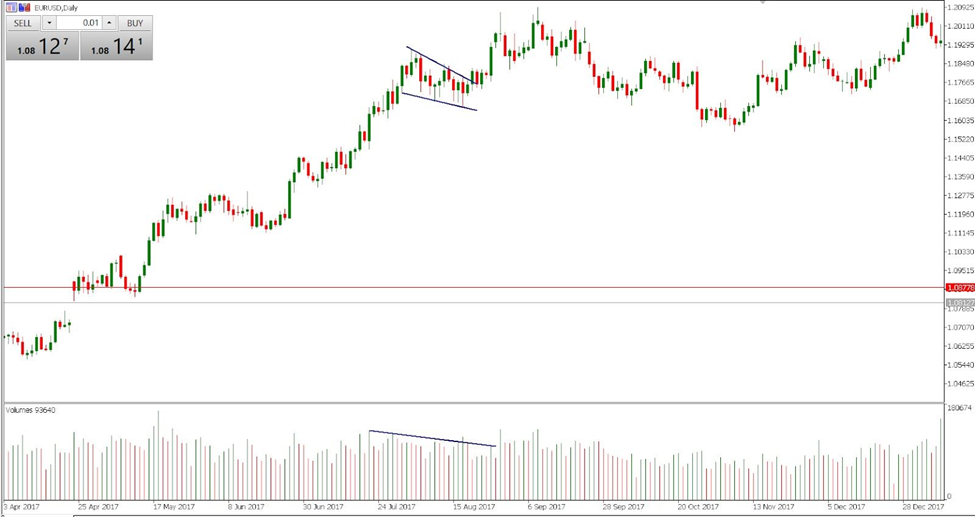
A daily chart of the EUR/USD is shown in the chart above. New short-term lows are being set as the price action pushes higher in an upward trend. The price of the pair then begins to decline, signaling the beginning of the consolidation phase as buyers use this time to gather their strength and get ready for another push upward.
You can observe that the volume is decreasing concurrently. The buyers push a breakout of the wedge just before the breakout happens, and the two trend lines approach one another, leaping higher to establish a new low. The breakout and the increase in volume both happen at the same moment.
Rising and Falling Wedge Patterns – Differences
There are two kinds of wedge patterns: falling (descending) and rising (ascending).
While a falling wedge pattern has both slopes sliding, an ascending wedge pattern happens when the slope of both the highs and lows climbs. The slope of the lows in an ascending wedge is steeper and eventually converges with the top trend line, whereas the slope of the highs in a descending wedge is steeper and eventually converges with the support trend line.
Rising wedges typically denote the onset of a negative breakdown as sellers assume control. On the other hand, a falling wedge pattern signals that buyers are building strength following consolidation and typically leads to an upside breakout.
How to Trade Falling Wedge Chart Patterns?
Let us consider the EUR/USD daily chart below. Once a descending wedge is spotted that fulfills all the criteria, you begin focusing on the important elements of a trade – entry, stop loss, and take profit along with the overall risk related to this trading opportunity.
At this point, volume data should be carefully considered. The continuous trend of falling volume is crucial because it indicates that despite the pullback, buyers are still in control and have not made big investments.
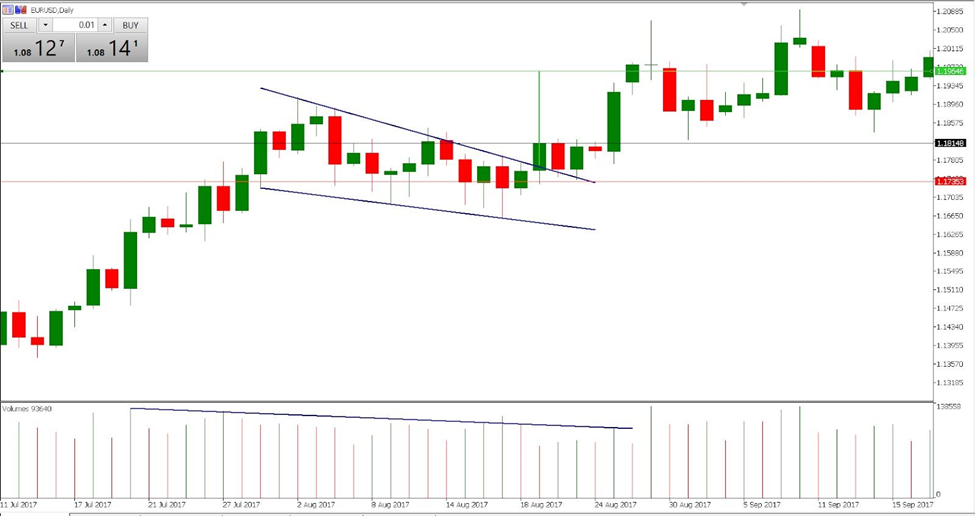
A daily close above the wedge must occur for the wedge break to the upside to be confirmed, and this is what exactly occurs. There are two options available to you at this time:
- You can enter a trade as soon as the close happens
- You watch for a possible pullback in the price movement to retest the broken resistance.
The first choice is safer because you cannot be sure that the pullback will happen at all. On the contrary, the second choice offers you entry at a lower cost. In this instance, we’ll choose the first option.
A stop-loss order should be set within the wedge, close to the top line. The pattern is invalidated by any closing that falls within a wedge’s perimeter. As can be seen, the price action in this instance pulled back and closed at the wedge’s resistance before eventually moving higher the next day.
Last but not least, you must choose your take profit order, which is determined by calculating the distance between the two converging lines when the pattern appears. The green vertical line, which was obtained in this manner, was then appended to the location of the breakout. As a result, you can find the exact take-profit level at the other end of a trend line.
The following are our trade details:
- Entry: 1.1815$
- Stop Loss: 1.1735$
- Take Profit: 1.1965$
As a result, we’re risking 80 pips to gain 150 pips, which equals a risk-to-reward ratio of almost 1:2. The profit-taking order was hit a week after we started our trade, netting us 150 pips.
Conclusion
The falling wedge is a bullish wedge pattern that can enable traders to identify a continuation of an uptrend and a trend reversal in a downtrend. Since it can produce both signals, it should be used in combination with other technical analysis tools, such as volumes, to determine its validity.
The falling wedge can be a useful tool in your trading toolbox, providing insightful information on possible bullish reversals or continuations. But to use this pattern in a real trading environment, it’s critical to have a thorough awareness of its nuances and intricacy.


