

New traders are often confident about their entries but they do not know when to get out of the trades. Every trader requires to work out an exit strategy before entering their trading setups. Without adding a trade exit in your overall trading plan, you leave yourself up to problems like utilizing your emotions as a justification to exit. One way to help you control all such trading problems is using an indicator known as the average true range (ATR).
Professionals have used this technical indicator for decades to improve their trading outcomes. It shows how much an asset or security has moved on average during a particular time frame and helps traders confirm their trade and place a stop loss.
The following article will examine the average true range indicator and how it can be used to identify exit opportunities to get maximum profit from our trade.
What is Average True Range (ATR)?
The average true range (ATR) is a technical analysis indicator that can measure volatility effectively and show how much an asset price moves, on average, over a specific period. It was developed by a popular technical analyst J. Welles Wilder Jr. and was subsequently introduced in his book “New Concepts in Technical Trading Systems” in 1978.
Unlike other technical indicators, the average true range indicator only gauges the degree of market volatility and not its price direction.
While it was initially introduced for commodity markets, traders now use ATR in several financial markets, including trading equities, indices, or cryptocurrency.
This volatility indicator represents an N-period simple moving average (SMA) of the true range values.
Traders generally use 14-period (as preferred by J. Welles Wilder), but it can also be intraday, weekly, or monthly.
Also, traders might employ shorter or longer time period depending on their trading preferences. Shorter time periods will boost trading signals, whereas longer time periods will be slower and possibly produce fewer trading signals. For instance, a shorter average that ranges from 2 to 10 days is ideal for measuring recent volatility (for swing and day traders). On the other hand, a 20 to 50-day moving average should be utilized to estimate longer-term volatility.
Average True Range Indicator Explained
The range of an asset is the difference between the high and low prices over a specified period. It provides details about the asset’s volatility, with large ranges denoting high volatility and small ranges denoting low volatility.
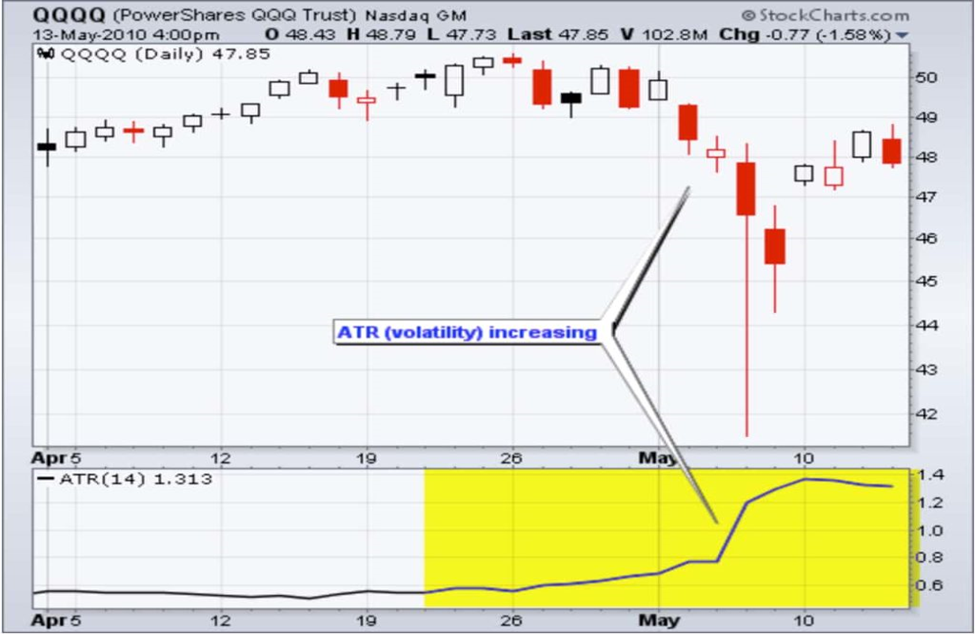
The ATR indicator fluctuates as the asset’s price moves become larger or smaller. As a result, a new ATR reading is computed after each period. For instance, a new average true range reading is computed each minute on a one-minute chart. On the contrary, a new average true range is computed every day on a daily chart. The statistics are subsequently plotted on a graph to create a continuous line, which gives traders an indication of how volatility has changed over time.
According to the general rule, a high ATR value denotes a larger level of market volatility, while a low ATR number denotes a lower level of market volatility.
ATR Calculation
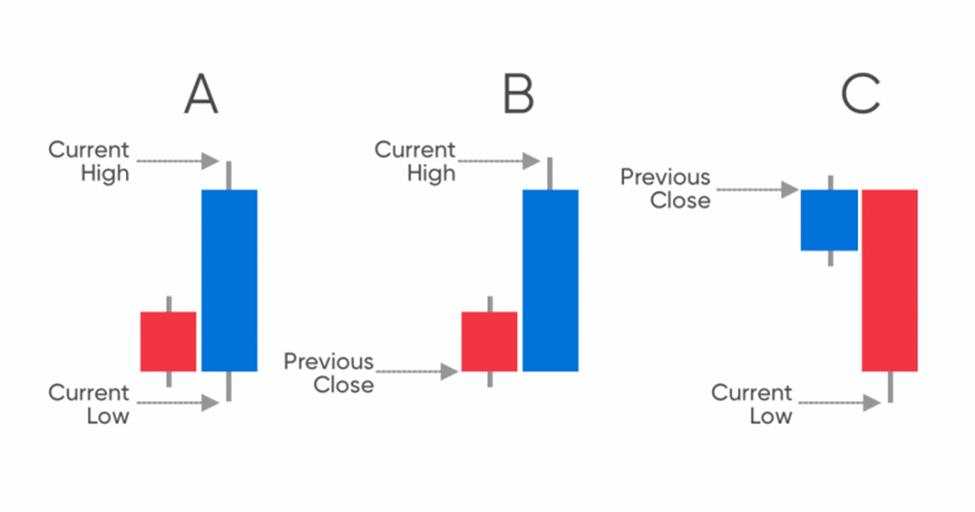
You must first compute a series of true ranges to calculate the ATR for the current day. The true range value is calculated by selecting the maximum of the following:
- The difference between the current high and current low
- The absolute value of the difference between the current high and the previous close
- The absolute value of the difference between the current low and the previous close
After calculating the true range of those time periods (let’s say, 14 days), traders will find their average.
Average True Range Formula
The average true range can be determined using the following formula:
Average True Range (ATR) = (Previous ATR x (n-1) + current TR) / n
Where:
TR = True Range
n = number of periods
How to Read ATR Values?
ATR values signify absolute price volatility rather than percentages. So, for instance, if an asset, having a previous close of $20, trades between $19 and $22, its present TR would be $3 based on the difference between the low and high. If the preceding ATR for the previous 13 days were $2, the asset’s average true range would be $2.07 according to the formula: (($2 x 13) + $3) / 14.
We can see that even though there is a buy signal for the stock, which has an ATR of $2.07 and has fluctuated within a $3 intraday range, the price has already risen over 40 percent above the average and might not have much further to go up. The asset is more likely to drop in price or stabilize within its recent price range.
On the contrary, if the price drops to the session low and the ATR for the day is greater than average, it may stabilize or climb higher to stay within the range despite a sell signal.
This highlights the value of employing the ATR as one of many technical indicators in a trading strategy. Instead of immediately selling or buying an asset because the reading is greater than usual, a trader would use it to verify trade based on their thorough analysis and specific approach.
Additionally, keeping track of historical data is crucial because even though an asset may trade much above or below the current ATR, the movement may be typical for the asset based on its price history.
It should be noted that ATR cannot be used to compare stocks since it signifies an absolute value rather than a percentage. For instance, the stock stated before, with a value of $2.07, would have an average price range of $2.07 over the time period. A stock with a TR of $300 and a prior ATR of $250 would have a current ATR of $253.57. This means that assets with higher prices have higher ATRs than those with lower prices, so they are not directly comparable.
How to use ATR Indicator in Exit Strategies
The average true range can be used as a part of your exit strategy regardless of the kind of entry used. The “chandelier exit” is a well-known strategy developed by Chuck LeBeau. It is used to keep traders in a trend and avoid an early exit so long as the trend is still in effect. Simply put, traders utilize the “chandelier exit” as a trailing stop-loss and hedge against losses brought on by trend reversals.
ATR Trailing Stop Loss
As mentioned earlier, the average true range indicator can be deployed to create an exit strategy by setting trailing stop-losses. A good rule of thumb is to multiply the current ATR by two to come up with a responsible stop-loss level. So, if you are going long, you might set a stop-loss at a point that’s twice the ATR below the entry price. If you are going short, you may set your stop-loss at a point twice the ATR above the entry price.
You can keep lowering the stop-loss to twice the ATR below the price if you are long and the price swings in your favor. The stop-loss here only travels upward, never below. It stays there once it has moved up until it can move up again. Alternatively, the trade is closed if the price declines and reaches the trailing stop-loss level. Short trades also fall under this. However, the stop-loss just shifts downward in that scenario.
Example
For instance, suppose you open a long position at $20, and the ATR is 50 cents. Afterward, you set a trailing stop-loss at $19 (2 * 50 cents below $20). The price increases to $21.00, however, the ATR stays at 50 cents. The trailing stop-loss has now been moved to $20. When the price rises to $22.50, the stop-loss increases to $21.50, securing at least a $1.50 profit. This continues until the price drops to the stop-loss level.
Conclusion
The average true range is a relatively straightforward indicator used to measure volatility. It is a useful tool for providing traders with exit points and can be used in combination with other indicators, such as Bollinger Bands, MACD, Stochastic Indicator, and Parabolic SAR.
What it can’t do, however, is predict the future. Due to this, traders must be careful to conduct their research, keep in mind that markets can change in ways that harm their positions, and never trade with money they cannot afford to lose.


