

The channel chart pattern, also known as a price channel, is a powerful technical analysis tool used by traders to identify potential trend continuation or trend reversal opportunities in the financial markets.
This pattern showcases price movement within two parallel trendlines, creating a channel-like structure. By studying the behavior of price action within these boundaries, traders can gain insights into the ongoing market trend, possible support and resistance levels, and anticipate future price movements.
There are two types of channel patterns – Ascending Channel Patterns and Descending Channel Patterns.
To know more about Ascending Channel, read ahead.
What is Ascending Channel Pattern?
In the simplest form, channels are referred to as consolidation periods that demonstrate price variations between parallel resistance and support levels. They are a normal thing on price charts that have been categorized into 3 types: Rectangular, Ascending, and Descending.
Talking about the Ascending Channel Pattern, is completely different from the rectangular formation in terms of sloping. The Ascending pattern slopes upward while as the name suggests, rectangle formation follows a horizontal path. Similarly, the descending channel stands differently from the ascending channel with its downward slope.
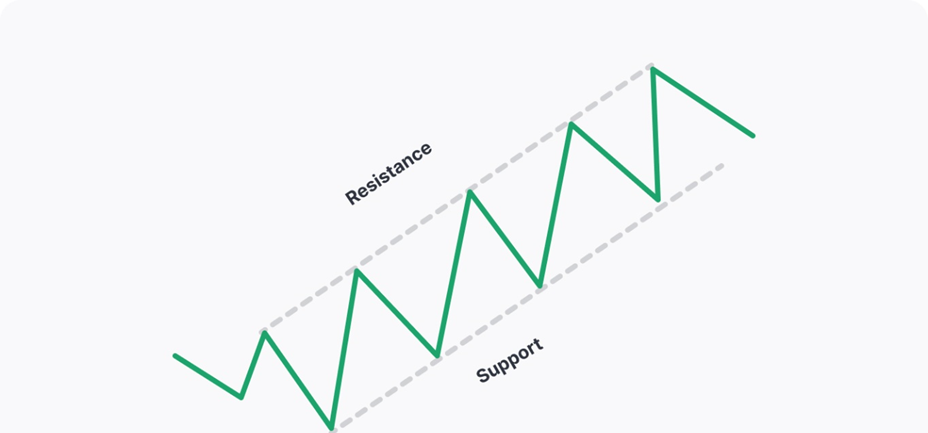
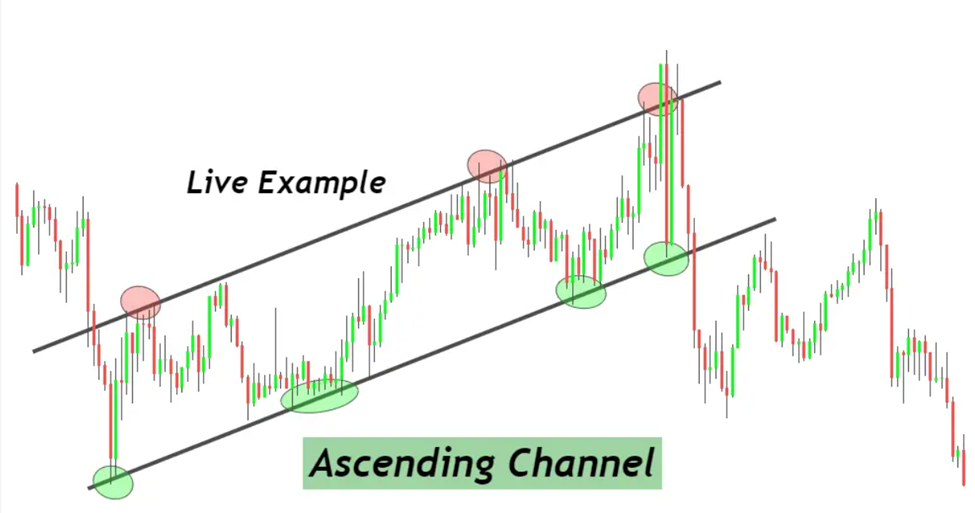
An Ascending pattern is also named an upward or rising channel pattern. This bullish formation is usually identified by its two parallel lines, which appear as soon as an asset’s price increases over time. The trend lines used to connect higher highs and lows showing support and resistance levels. Moreover, these two lines create borderlines for the price to interact with.
How Does it Work?
The rising channel pattern is responsible to identify the nature of the trend prevailing in the market. Whether it demonstrates a bullish trend or bullish reversal, the ascending channel patterns always come in handy.
If an asset is experiencing an increase in price within the channel’s boundaries, it is referred to as a bullish trend. Here, boundaries mean two trend lines moving in parallel.
On the contrary, if the price breaks the lower trend line, it confirms a trend reversal or bearish situation.
Key Points to Drawing an Ascending Channel Pattern
Drawing an ascending channel pattern requires attention to specific key points.
Identify the upward trend by locating at least two swing lows and drawing a trendline connecting them.
Locate at least two swing highs and draw a parallel line to the trendline, ensuring it touches the highest points.
This forms the channel boundaries. It is essential to maintain a consistent distance between both trendlines, thereby representing the channel’s width. The channel tends to be useful until a product’s price remains within the limit and increases over time.
Tips to Trade with the Ascending Channel Pattern
When it comes to trading with the ascending channels, traders have to choose either of the two approaches:
Mean Reversion
It revolves around trading with the range. In the mean reversion strategy, traders have the freedom to decide whether to sell at resistance or buy at support. It anticipates that an asset’s price may go back to at least the median of the range. However, if there is any possibility of a breakout, the anticipated point would be beyond the range and at the next level above the first targeted point.
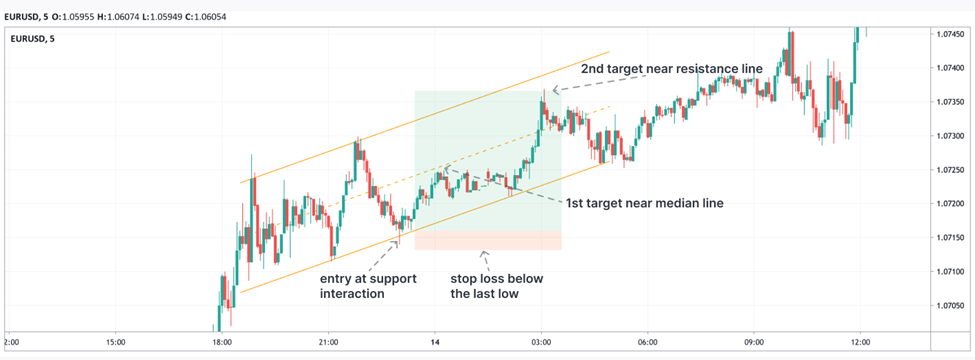
In this example, the entry has been made on the support level, thereby giving a third interaction point leading to a bounce. The stop-loss has been placed lower than the last low so that the scenario remains in favor of traders.
The first targeted point is present at the median trend line, which shows a possibility of a breakout as soon as there is a rejection. Though, risk management can play a significant role in handling the situation. Traders may opt to raise a take-profit order and try to put it near the resistance level.
Breakout
The ascending channel breakout has turned out to be one of the reliable trading techniques in the market. It focuses on breaking the price through either of the boundaries.
Breakout’s direction says a lot about the trend i.e. a break moving downwards indicates a continuation of a downtrend or bearish reversal of an uptrend or vice versa.
If traders assume that the price is moving within the range, chances are it could be a false breakout signal and they have to wait for a breakout confirmation ahead of a trade.
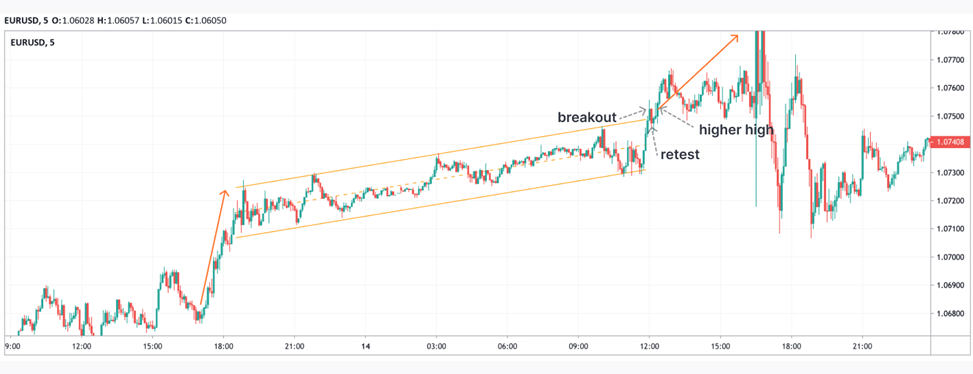
Breakout Confirmation
It’s important to consider 3 points:
1. The price should move beyond the boundary
2. The boundary should be retested
3. A trade must be validated after 3 confirmations, where the price surpasses the high breakout point in an uptrend and vice versa.
Important Elements in Trading the Ascending Channel Pattern
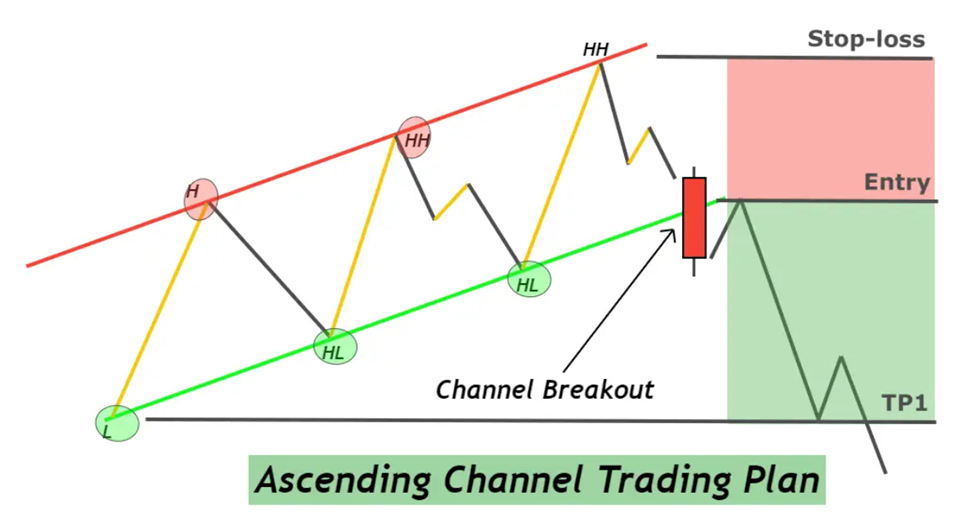
- Open Sell Order: As soon as there is confirmation of the rising channel breakout, traders must open a sell order. In some cases, they can wait for a minor pullback in price to place the sell order so that there could be a better risk to reward ratio against the stop-loss order. The worth mentioning fact is market conditions- investors may wait for some retracement and analyze the RR ratio. If it is stable and favorable, open a sell order right after the channel breakout.
- Stop-Loss Level: It’s recommended to try putting a stop-loss order above the last high with the rising channel. This way, traders can increase their chances of earning more rewards than before.
- Target Level: The target level should begin from the starting point of the ascending channel (TP1). Now, draw a descending channel of the asset’s price and close all trades after the channel breakout, showing bullish nature. This step will bring some incredible changes in an investor’s trading nature.
- Risk Management: Traders should try to maintain the minimum risk-reward ratio i.e. 1:1 so that the ascending channels can work efficiently and bring the best out of it.
- The risk per trade must not exceed 2% of the total investment. If the ratio goes below 1:1, it’s recommended to wait until the price retraces. It provides an opportunity to put a sell order while waiting for the risk-reward ratio to go beyond 1.
Conclusion
Overall, it can be said that the ascending channel is one of the reliable and versatile technical indicators to identify and analyze trends. It helps to make informed trading decisions.
It doesn’t matter how experienced a trader is, the ascending pattern can always assist in minimizing risks and maximizing returns in the trading market.


