


Swing trading has gained popularity as a form of trading in the financial markets. Swing traders seek to profit from market swings or turning points that can occur over time. These “swings” result from the increasing and dropping prices of the market, which are influenced by buying and selling cycles. But how do swing traders spot these possible price turning points? This is where the role of swing trading indicators comes into play and gives clues to the users on the trend of the market by analyzing price data. DeMarker indicator is one swing trading indicator that measures the demand for the underlying asset by comparing the highs and lows. Tom Demark developed this technical indicator and is a prominent name in the technical analysis space.
Below we will explain everything you need to know about the DeMarker indicator and how to incorporate it into your trading routine to maximize profits.
What is the DeMarker Indicator?
The DeMark or DeMarker indicator, also referred to as DeM, is a technical analysis tool, which compares the maximum and minimum prices for the current period with the equivalent price of the previous period to form an oscillating line that helps visualize directional bias as well as overbought and oversold conditions. It has become a useful tool for evaluating the directional trend of the market because it tends to level out during trends before indicating an imminent change.
It belongs to the oscillator family of technical indicators and has been developed by a modern Market wizard, Tom Demark. Tom Demark is a legendary trading expert who often appears as a guest on Bloomberg TV and CNBC. If that wasn’t enough, he also served as Steven A. Cohen of Point 72 Asset Management’s financial advisor. Steven Cohen is one of the most prosperous hedge fund managers in our era. Paul Tudor Jones, the renowned hedge fund manager who correctly predicted the October 1987 meltdown, was also one of Demark’s previous clients.
Tom Demark built various indicators that have passed the test of time. The DeMarker indicator and TD sequential indicator are two of the most popular and influential Tom Demark indicators.
DeM indicator is regarded as an oscillator due to its changing curve, which spans a 0 to 1 range. However, few versions of the DeMark indicators use a scale of -100 versus 100, or 100 and 0. The indicator frequently has warning signals set at 0.30 and 0.70 values, with readings outside and within these ranges being regarded as high and low danger, respectively. When the curve crosses these boundaries, it indicates overbought and oversold conditions.
DeM works similarly to the commonly deployed Relative Strength Index (RSI), however, it focuses on the intra-period highs and lows rather than closing levels. This reduces the possibility of chaos that can skew other indicators. As the indicator oscillates between its extremes, it demonstrates the shifting tides of buying and selling pressures.
Although the DeM analysis’s normal time is 14 days, it may be applied to any time frame and can smooth out over longer time scales.
Calculating the DeMarker Indicator
The calculation of the DeMark indicators is not mandatory because it can be done automatically by computer software. Nevertheless, understanding its calculation can help you when applying it in trading strategies.
The formula for the DeM indicator is:
DEM = SMA (DeMMAX) / [SMA (DeMMAX) + SMA (DeMMIN)]
Where
DEM stands for DeMarker
SMA stands for simple moving average
DeMMAX – tracks the difference between the most recent high and the previous high.
DeMMIN – tracks the difference between the present low and the prior low.
Here is the formula for DeMMAX and DeMMIN:
DeMMAX = High – Previous High if the difference is positive else 0
DeMMIN = Previous Low – Low if the difference is positive else 0
How to Read the DeMarker Indicator?
The DeMarker indicator attempts to measure the market strength by comparing the current highest high with the current price. It also shows overbought and oversold circumstances, at the same time, and from these, seeks to spot points of trend exhaustion. The values produced by the DeM, which range from 0 to 1, are used to denote overbought and oversold market circumstances.
Here is how you can read the indicator:
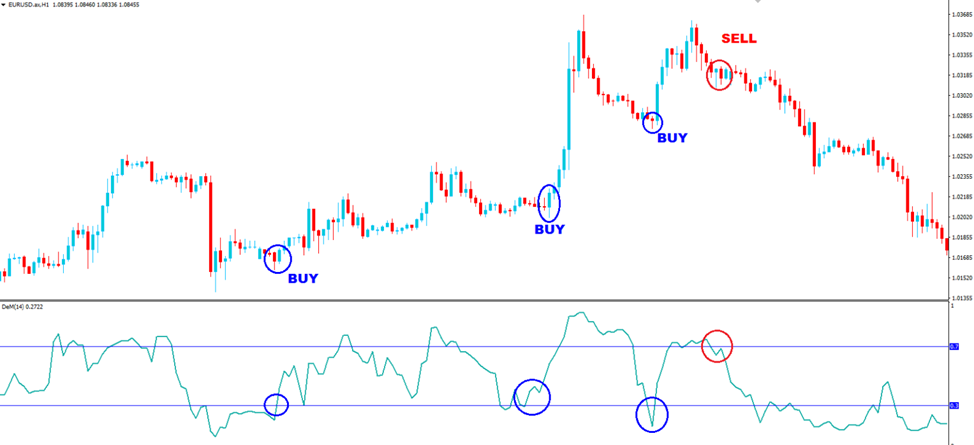
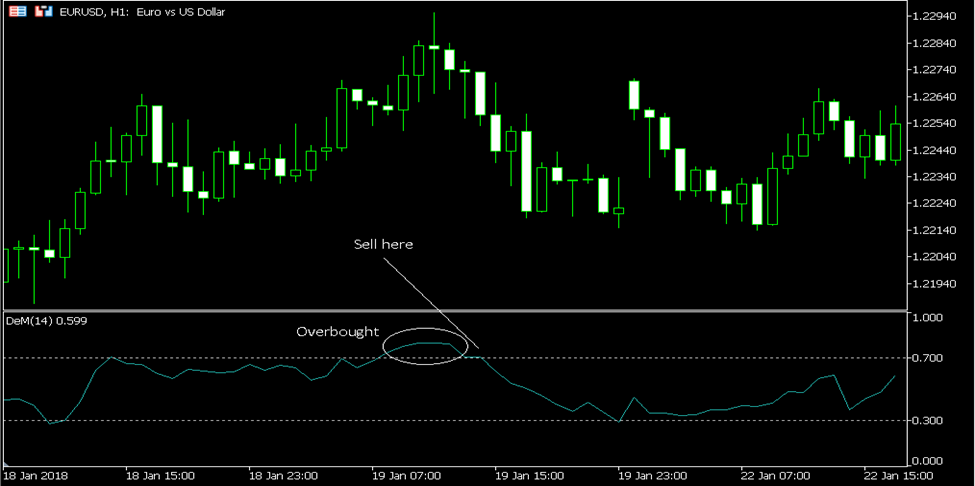
Overbought Conditions
When the DeMark value goes above 0.70, it indicates that the market conditions may be overbought and a possible price reversal is about to occur. Wait for the index to fall back below 0.70 and then sell or take profits.
Oversold Conditions
When the DeMark value goes below 0.30, it indicates that market conditions can be oversold and a possible price reversal is about to occur. This suggests a buy signal. Wait for the index to increase back above 0.30 and then buy.
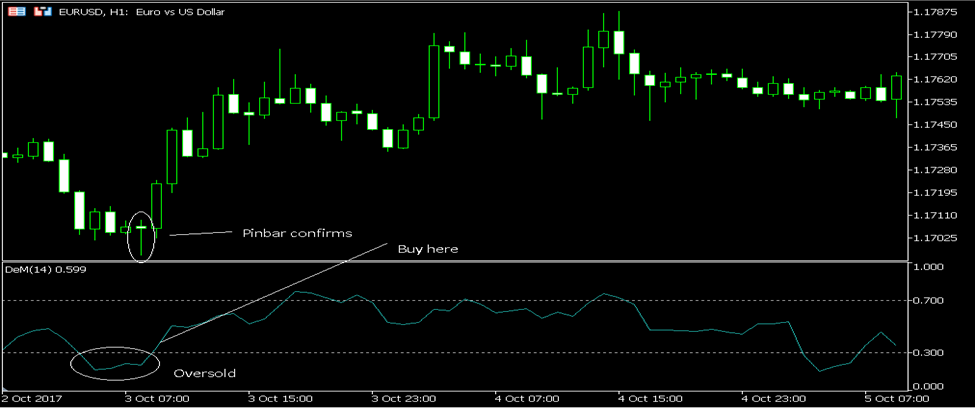
While some like to exit at 0.50, others could attempt to follow trends.
Neutral Conditions
When the DeMark value is between 0.30 and 0.70, the market is said to be neutral, and the trend’s direction is unclear.
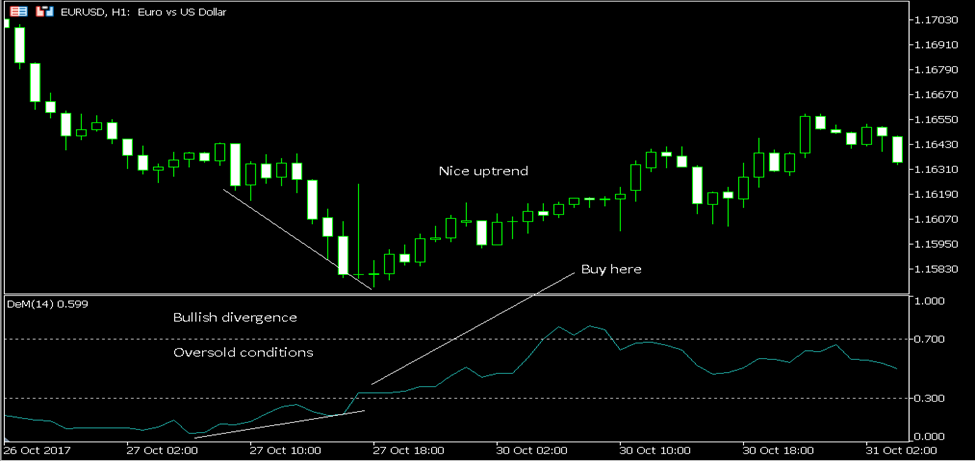
Divergences
You may occasionally see divergences between the oscillator and the price. This may also lead to bullish and bearish setups:
- A bullish divergence occurs when the DeM increases (higher lows) while the price falls (lower lows). You should buy.
- A bearish divergence is seen when the price increases (higher highs) while the DeM falls (lower highs). You should sell.
All technical indicators use historical market behavior to forecast future prices. Although no indicator is perfect, using the DeMarker with other tools can give you an advantage and help you make more profitable trades.
DeMarker Indicator Trading Strategy
The DeMarker is essentially a contrarian technical indicator. It operates to identify overbought and oversold market conditions, signaling probable changes in the price direction, as we previously explained.
Hence, we are currently using the DeM indicator to pinpoint probable price levels where a change in price direction could occur shortly. Below is shown a USD/JPY daily chart, which trades in a downward trend as the price action has been producing a string of lower highs and lower lows.
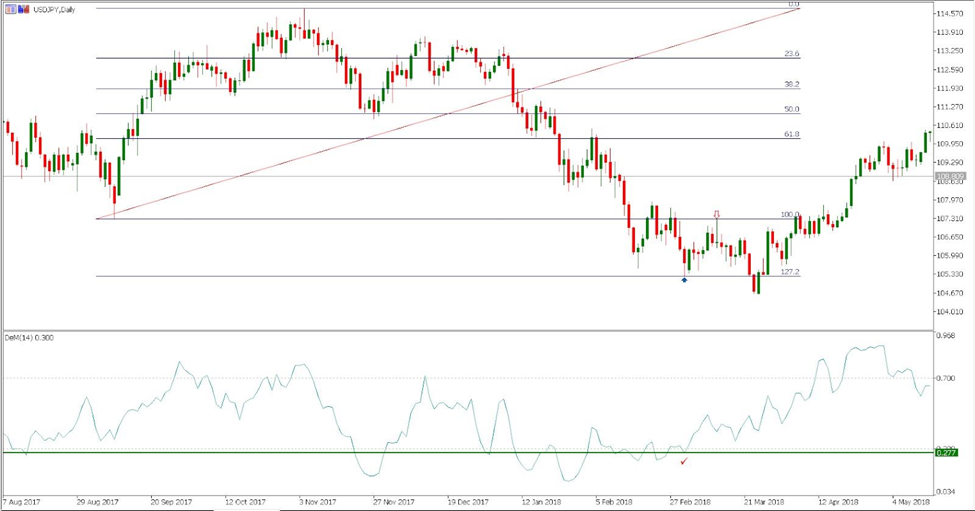
We know that DeMark indicators work best when combined with other technical indicators. For this reason, the Fibonacci extensions are being used to pinpoint support levels where the sellers might stall, giving buyers a chance to raise the price movement.
The blue arrow indicates the point at which the price action hits the 127.2% Fibonacci extension support, indicating that buyers are likely to enter the market at this price level and push the price higher. At this moment, there is a higher probability of sellers exiting their profitable trades.
The DeMarker value of 0.277 shows that the market is in oversold territory. We currently have a confluence of two bullish signals – DeMarker’s market oversold indicator and price movement, which is getting close to the first Fibonacci extension support.
As a result, the method is predicated on using additional indications along with DeMarker to spot potential turning points in price action.
The entry point should be where 127.2% is first reached, and the stop-loss should be set up about 40–50 pip below this level to guard against whipsaw losses brought on by market movements.
Take profit is placed at the beginning of the Fibonacci extension or the location of the main horizontal support. The market had begun to go higher from this position before the bears reversed all gains and drove the price movement below this crucial support level.
We anticipate that the market will want to go back to the “crime scene” and retest the same level, but this time in the context of resistance. This is what ultimately occurs, and our trade is then finally completed. We were able to bank in about 200 pips while only taking 50 pips or less risk. This risk-reward ratio is excellent. This example gives an insight into how to use DeMarker with other technical tools.
Conclusion
Several Tom DeMark indicators exist, but the DeM indicator is the one that is most well-known among retail forex traders. It is used to confirm if a market is in a non-trending or trending state and can aid in locating setups where price may reverse, whether you are monitoring the overbought and oversold regions or searching for divergences. It might not be very popular in day trading, but most professional traders use it.
It is not always the best course of action. False positives can happen, but when utilized with other indicators, the probability may be in the trader’s favor.


