

Technical analysis (TA) is a popular way of researching both the stock market and any other asset in order to determine its current position and development prospects. Therefore, technical analysis (TA) uses methods aimed at studying the internal life of markets, and their emotional state, that is, the degree of optimism and pessimism of participants. In fact, the best strategies are those based on multiple components of technical indicators analysis, such as moving averages and parabolic SAR.
It is up to the skill of the investor to know how to effectively combine multiple elements, including parabolic SAR trading strategy, to form a well-rounded approach.
Why do Combine Moving Averages & Parabolic SAR?
Moving averages excel at identifying the overall trend, but can lag behind price movements. The Parabolic SAR, on the other hand, is a trend-following indicator that reacts more quickly to price changes, but can generate false signals during choppy markets.
By using them together, traders can leverage the trend confirmation of moving averages with the faster reaction time of the Parabolic SAR for potentially better entry and exit points in the market.
Delving Deeper into Moving Averages
The moving average (MA), as the simplest trading tool, has many fans. It is popular among traders due to its compatibility with other indicators – it effectively complements many strategies and can be used with any other trading tool.
There are many strategies using moving averages: for example, MA can be used to support oscillating indicators. The versatility of moving averages allows them to be used both for day trading and for trading on longer time frames.
There are three most common types of MA’s, each its own responsiveness to price changes:
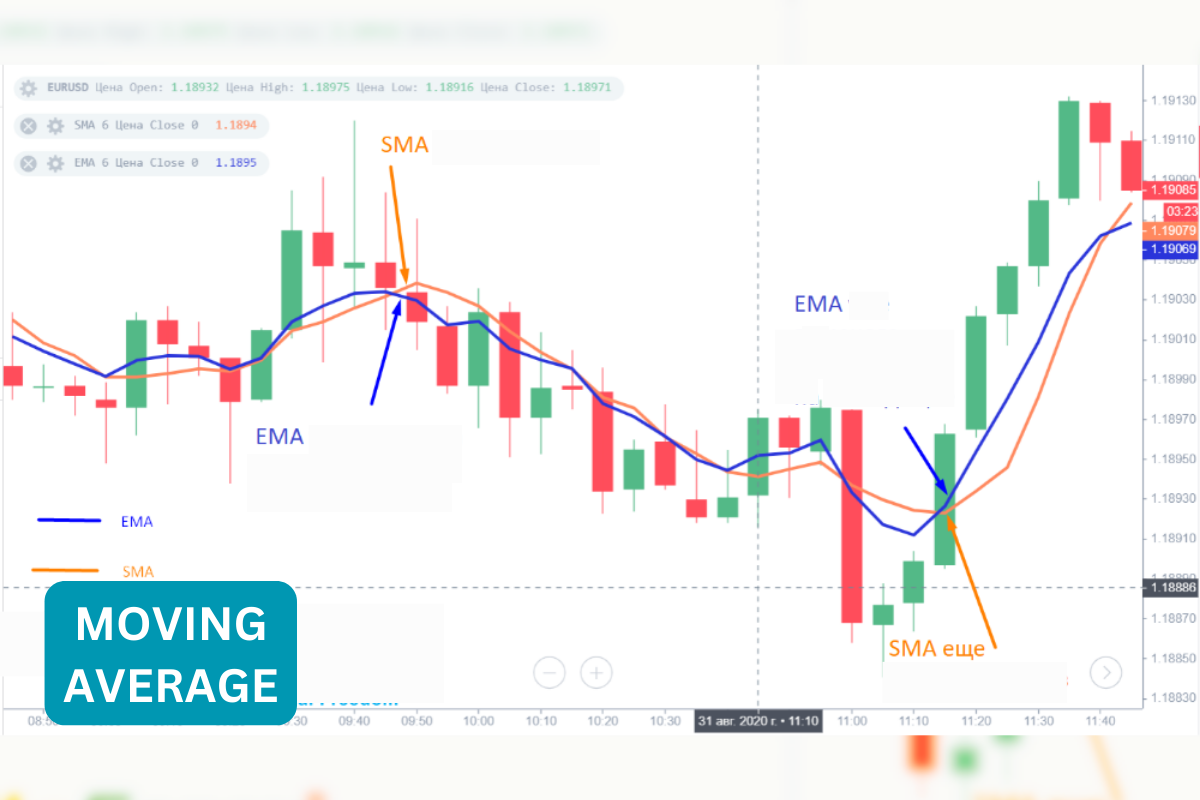
Simple Moving Average (SMA)
The simple moving average or SMA treats all prices the same. The current indicator value is the average price for a certain period.
For example, for a given period (8), the current value will be equal to the average price for the last 8 periods.
It turns out that the SMA is a certain center around which the price fluctuates. The further it is from the SMA, the more “enthusiastic” it will strive to “get closer.” EMA is a visual representation of where the quote is moving now.
Exponential Moving Average (EMA)
The moving average EMA is more popular than the others. Probably because of its visual fluidity.
Let’s look at it in more detail.
The current value of the indicator contains the current price, its previous value and their significance coefficient.
If the current price has greater significance, then the indicator will react faster to new information and look more zigzag. If it is the second way, then the indicator will stop its movement only on strong and / or long-term price movements.
Weighted Moving Average (WMA)
There is also a WMA. The bottom line is this: Current quotes have the greatest value, and the price for each previous period is less and less.
It turns out to be a kind of analog of the Simple moving average but with an emphasis on the “now” moment. Therefore, using the WMA price crossover as confirmation of a trend direction change is not a good idea. Why? Too much emphasis on recent prices – the indicator will always be very close to current quotes. There will be many “false” signals.
In the case of Weighted moving average, I recommend taking a closer look at any counter-trend strategy like “reversion to the mean.”
Beyond simply calculating the average, a key aspect of using moving averages involves interpreting their signals. Here are some common interpretations:
- Interpreting Moving Average Signals:
Crossovers:
When a shorter MA crosses above a longer MA (bullish signal), it suggests a potential uptrend. The opposite (shorter MA falls below longer MA) is a bearish signal, indicating a potential downtrend.
Unveiling the Parabolic SAR for Trend Reversals
PSAR translates as “Parabolic Stop And Reverse” – “Parabolic Stop and Reversal”. It is a trend indicator with minimal lag that can be used on almost any time period.
It was this factor, together with good forecasting accuracy, that became the reason for the great popularity of Parabolic. SAR is a trend indicator. It shows who is stronger in the market – bulls or bears and allows you to determine in advance the prerequisites for a change in trend.
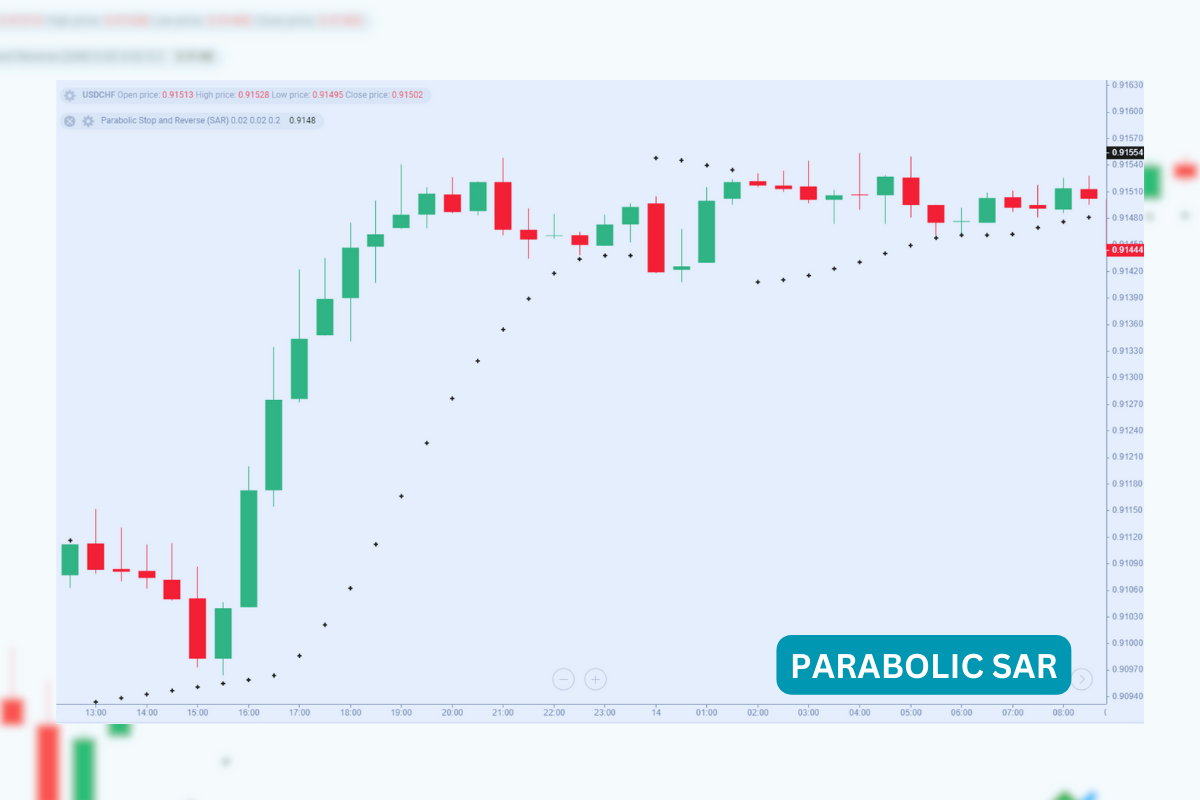
Graphically, the indicator looks like dots, each of which corresponds to its own candle. In an uptrend, the points are located below the bars, and in a downtrend, above. If a correction or reversal is formed, the point “jumps” to the opposite side.
To round out the description of the Parabolic SAR, I would like to add that it can also be a stop loss and trailing stop level. At the moment the price crosses the current indicator point, the trader receives a signal to correct the trend or reverse it.
It places dots above or below price bars:
- Below price bars in uptrends: Signals potential buying opportunities.
- Above price bars in downtrends: Signals potential selling opportunities.
As the trend strengthens, the SAR accelerates, visually represented by the dots getting closer to the price. A flip in the SAR’s position relative to the price bars can indicate potential reversals.
Parabolic Stop And Reverse Indicator
The resulting Parabolic indicator allows you to calculate both the beginning of a new trend and its completion. At the same time, PSAR does not try to guess the peak of the movement but follows the trend, making it possible to maximize profits by gradually shifting the level of fixing losses.
The indicator can be used on any trading instruments with prevailing trend movements. At the same time, the developer does not recommend trading on charts below one hour. Also, the indicator is not recommended for use when prices fluctuate in the flat. In moving sideways markets Parabolic gives a large percentage of erroneous signals.
To use it safely, it is necessary to exclude flat trading. To do this, you can use Bollinger Bands. Then, using Parabolic, we confirm the presence of trend acceleration. Acceleration will occur as long as the indicator points maintain their position below or above the price chart, depending on its movement vector. When the Parabolic SAR reverses, a trend reversal signal occurs.
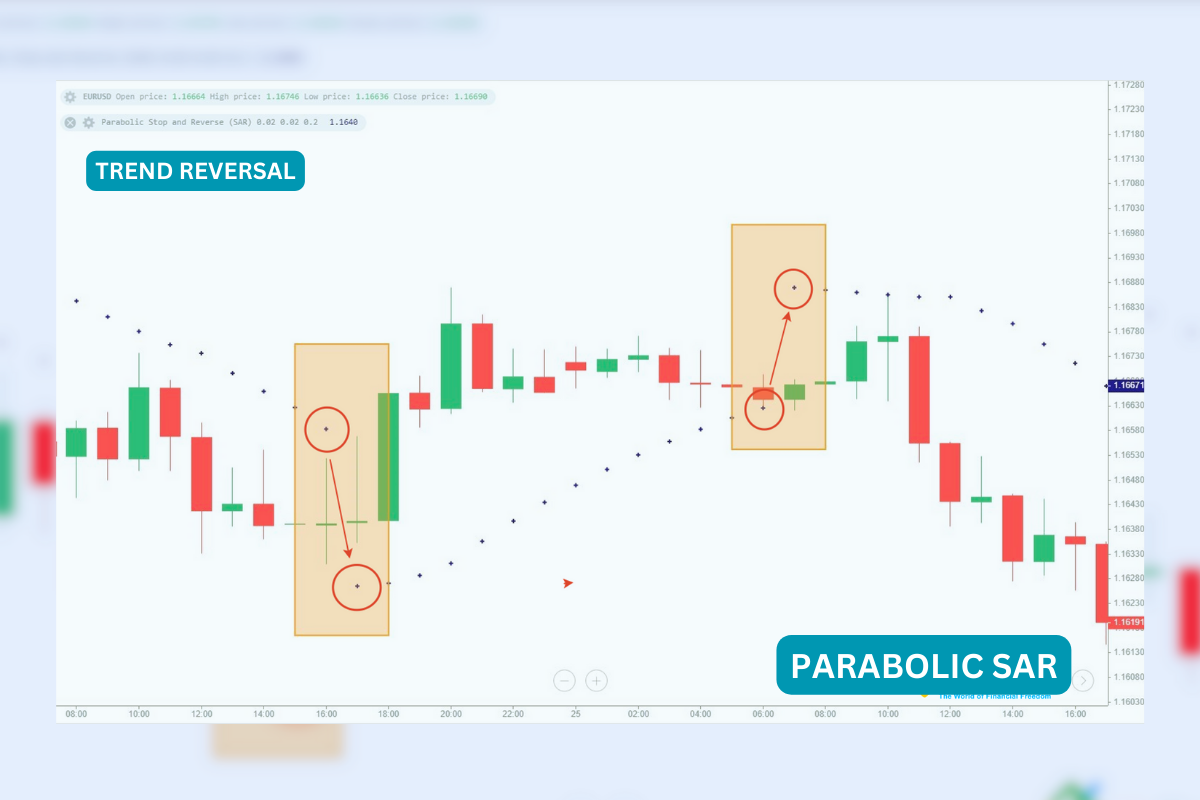
On the EURUSD chart, yellow areas mark the moments of PSAR reversals. Such situations indicate a trend reversal. And the rest of the time, when the points are stably above or below the candles, a directed movement occurs.
Combining Moving Averages and Parabolic SAR for Enhanced Trend Analysis
The true magic happens when you combine moving averages (MAs) and the Parabolic SAR (SAR). Here’s how they work together:
- Confirmation and Refinement:
MAs provide the big picture trend, while the SAR helps pinpoint entry/exit points within that trend.
Imagine a buy signal:
- Price breaks above a key moving average (e.g., 50-day SMA).
- Simultaneously, the SAR flips below the price bars.
This confluence suggests a potential uptrend, potentially confirming a buying opportunity.
But what if the SAR is prone to throwing out false signals, especially in volatile markets? Here’s where the beauty of this combination lies.
Parabolic SAR Signals Get a Boost: Parabolic SAR signals become more effective if they are accompanied by other trading indicators, such as moving averages. The combination of indicators means that there is less chance of inefficiency when using long or short periods of one of them. This increases the likelihood of a successful trade.
MAs Provide Context for the SAR: A suitable context for Parabolic SAR data is provided by, for example, the moving average method. If the price is above a key long-term trend line, such as the 200-day moving average, Parabolic SAR uptrend signals can be considered more reliable. The same can be said about downward trends, only in this case, everything would be flipped. The moving average essentially paints a broader picture of the overall market direction, allowing you to interpret the SAR’s signals with greater confidence.
Conclusion
Unveiling trends is crucial for navigating the ever-changing markets. This guide explored the power of combining moving averages and the Parabolic SAR. By understanding these tools and practicing disciplined risk management, you’ll be well-equipped to make informed trading decisions and potentially chart your course to success. Remember, continuous learning and adaptation are key in this dynamic landscape. Happy trading!


