In the world of cryptocurrency and trading, the Parabolic SAR Indicator or PSAR is a useful tool. Traders worldwide use the PSAR Indicator to make their charts.
Basically, it is a trading tool, which traders use to decide trend direction and probable price reversals. The tool implies a trailing stop and reverse method known as SAR to identify suitable entry and exit points.
In this blog, we will explore more about the PSAR Indicator and understand how to use it. So, if you want to learn more, please continue reading.
What is Parabolic SAR?
J Welles Wilder developed a trend-following indicator called Parabolic stop and reverse. It is commonly known as the Parabolic SAR or PSAR Indicator. The Parabolic SAR is a technical chart used to determine an asset’s price direction and get our attention to when it is changing. It is sometimes known as the stop and reverse system.
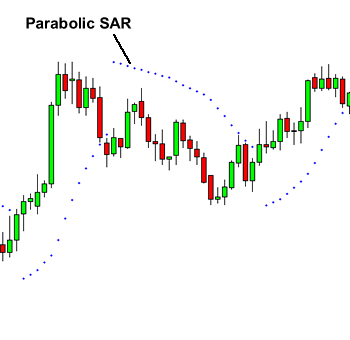
The chart is displayed as one Parabolic line or dots used with trend direction.
During uptrend the Parabolic SAR places dots underneath the price, while in a downtrend, they are above them.
a dot below the price is deemed a bullish sign while the one above is deemed bearish
The tool offers 3 major functions. First, it highlights the current price direction or trend. second, the chart provides probable entry signs. third, it provides potential exit signs.
This indicator is mechanical and will always generate new signals to get long or short. It is up to you to determine, which trades to take and which to leave.
To give you an instance, when the trend is down, it is wise to take only the short sales. On the other hand, if it is up, you should go for the buy signals.
Parabolic SAR Formula
The Parabolic SAR Indicator uses the most recent extreme Point in price or EP with an acceleration factor or AF. These elements determine, where the dots will appear in the hourly chart. Let’s take a look at the formula for Parabolic SAR calculation.
- Uptrend: PSAR = Prior PSAR + Prior AF (Prior EP – Prior PSAR)
- Downtrend: PSAR = Prior PSAR – Prior AF (Prior PSAR – Prior EP)
Here EP is the highest high for the current uptrend and lowest low for the current downtrend, while AF is default 0.02 increasing every time by it, when a new EP is reached. The maximum acceleration AF can be 0.20.
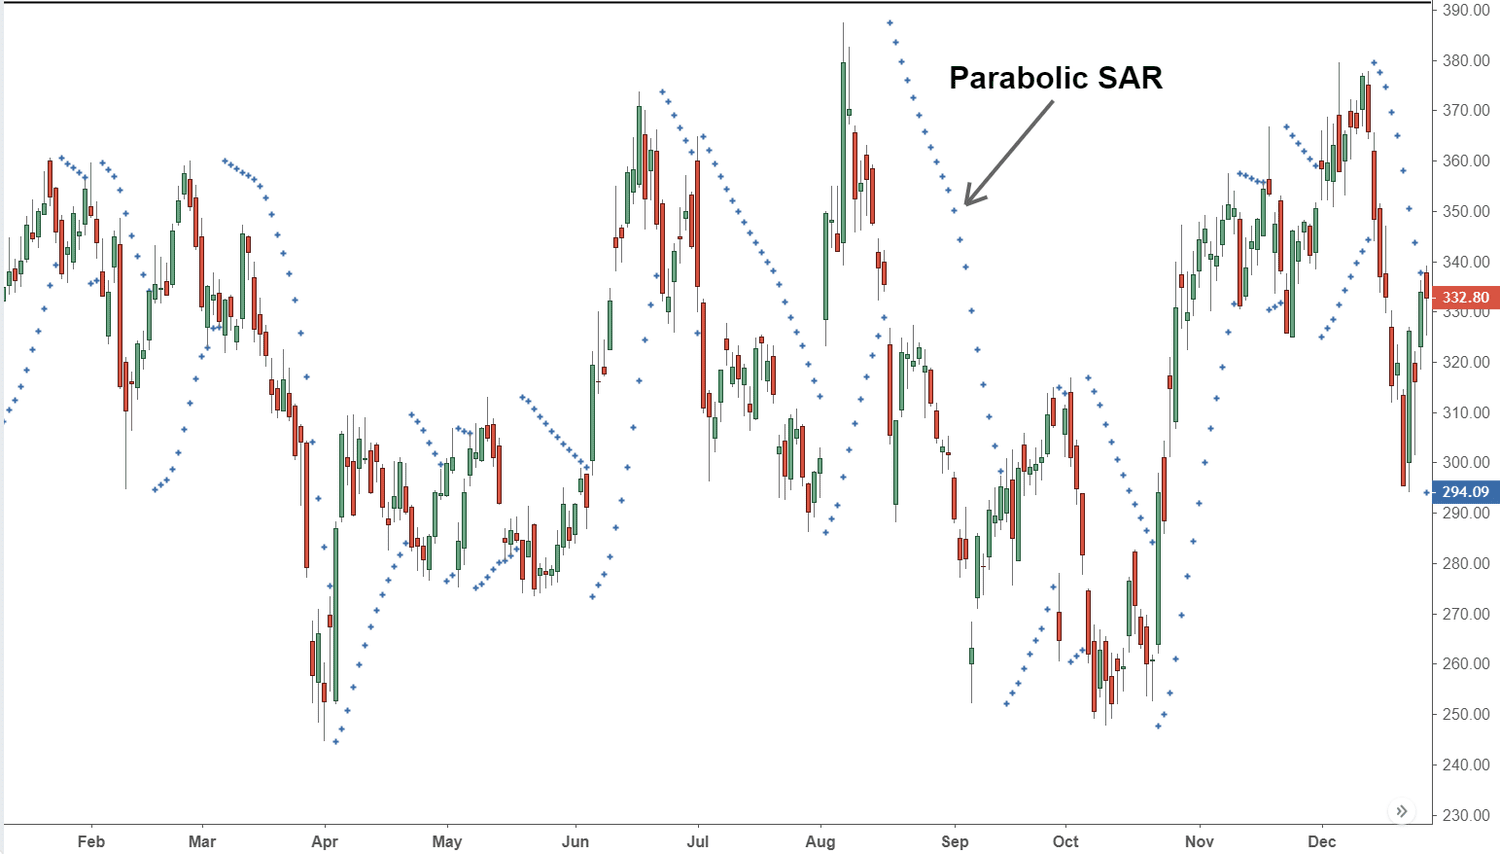
This calculation creates a dot below the rising price action or above the falling one. these dots help highlight the current price direction in the parabolic curve. They are always present. It is the reason the PSAR is called the stop and reverse.
When the price falls below the rising dots, the dots get on top of the bars. When the price increases through the dots, the dots flip below the price.
The final word is that, fortunately the SAR charting software does all the math for us. However, it is still useful, knowing how to memorize the numbers for yourself.
What does the Parabolic SAR Indicator generate?
The Parabolic SAR Indicator creates buy or sell signals, according to the position of the dots relevant to the asset’s price.
To give you an example, you get a buy signal, when the dots move from above the price to below the price. respectively, a sell signal will occur, when the dots move from above the price to below the price.
How to Use the Parabolic SAR Indicator?
You basically use the Parabolic SAR to buy, when the dots move below the bars and sell or short-sell, when they move above. The former indicates an uptrend while the latter indicates a downtrend, resulting in constant trade signals as you will always have a position.
It is good, when the price is making big swings back and forth as each trade will result in capturing profits. However, when the price is making small moves in each direction, these trade signals can result in heavy losing trades in a row.
thus, it is wise to analyze the day’s price action to determine whether the trend is up or not. It is the key to Parabolic SAR Trading.
The PSAR moves regardless of whether the price moves or not, meaning that if the price is increasing in the beginning but then the price moves sideways. The Parabolic SAR works still, despite the price movement sideways.
The Parabolic SAR will generate a reversal signal, eventually, even if the price hasn’t dropped in the trend. The Parabolic SAR only requires catching up to the price to create a reversal signal.
For this reason stated, a reversal signal on the Parabolic SAR Indicator doesn’t necessarily indicates that the price is reversing.
The Parabolic SAR Indicator creates a new signal, each time it moves to the opposite direction of an asset’s price. It always ensures a place in the market, making the Parabolic SAR Indicator appealing to active traders.
The SAR Indicator works most effectively in a trending market or markets where large price moves allow traders to capture major gains. When a security’s price is range bound the SAR Indicator will be constantly reversing. It will result in multiple small profits or losing trades.
How to use Parabolic SAR in Your Trading Strategies
To create a Parabolic SAR Trading Strategy, first, you should determine trend direction and establish it. If a current trend is present, you should take the trend signals in the direction of the overall trend.
To give you an example, if the the trade signal goes down, you should only take short trade marks, when the dots flip on top of the price bars. On the other hand, if the dots flip below the price bars, you should exit. This way, you will utilize the indicator for its strength, which is catching trending moves.
overall, if you have established a complete trend, you will not require worrying about the weakness of the indicator, which is non-profitable SAR Trading signals, when there is not a trend.
Marking Stop Loss with Parabolic SAR
The Parabolic SAR or PSAR is also a method to set-up stop loss orders. When a stock is increasing in price, you should move the stop loss to match the Parabolic Indicator. The same concepts applies to short existing trades.
It means, as the price falls, so will the Indicator. So, all you have to do is move the stop loss to match the level on the indicator after every bar moves.
Using Parabolic SAR for Trailing Stop

You can use Parabolic SAR to make trailing stops. The trailing stop loss is a method, which traders can use to exit a trade. As the price changes, SAR adjusts stop losses to maintain a fixed percentage or dollar amount above or below the price in the trend.
To give you an example, if you buy a stock at 50 dollars and place an SAR stop loss at 45, your position is sold when the price drops to $45. However, if the stock price in the trend increases to 55, your stop loss will become 50.75$.
This way, trailing stop losses in SAR can help you hold profits as a trade in the market becomes favorable. Stop losses in SAR will also protect you against losses, if the trend in the market becomes unfavorable.
You can put stop losses based on a fixed percentage from price or dollar amount or use more sophisticated version as Parabolic SAR based stops in the trend.
The Parabolic SAR vs. a Moving Average
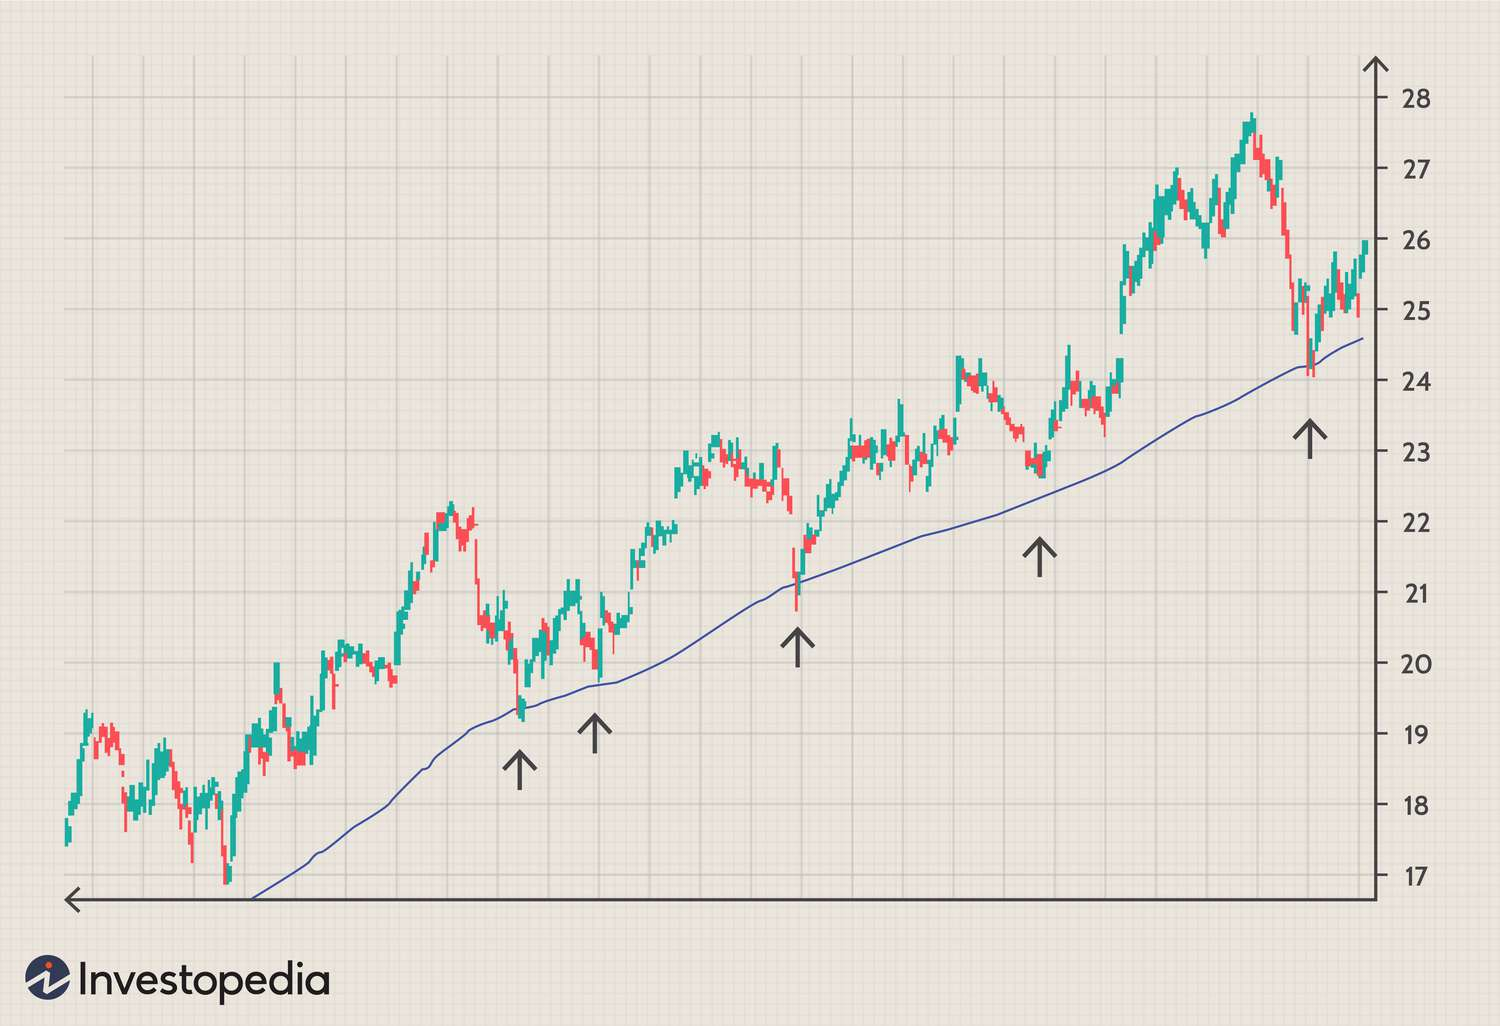
The only difference between the Parabolic SAR and MA is that they both track the trading price action and price movements and help show the current trend. However the MA technical indicator uses a different formula.
The MA takes the average price over a select number of periods and then, plots it on the chart. However, the PSAR looks at extreme highs and lows before applying an acceleration factor. These varying formulas look very different on the chart and will offer different analytical insights and signals.
Using Parabolic SAR with Other Indicators
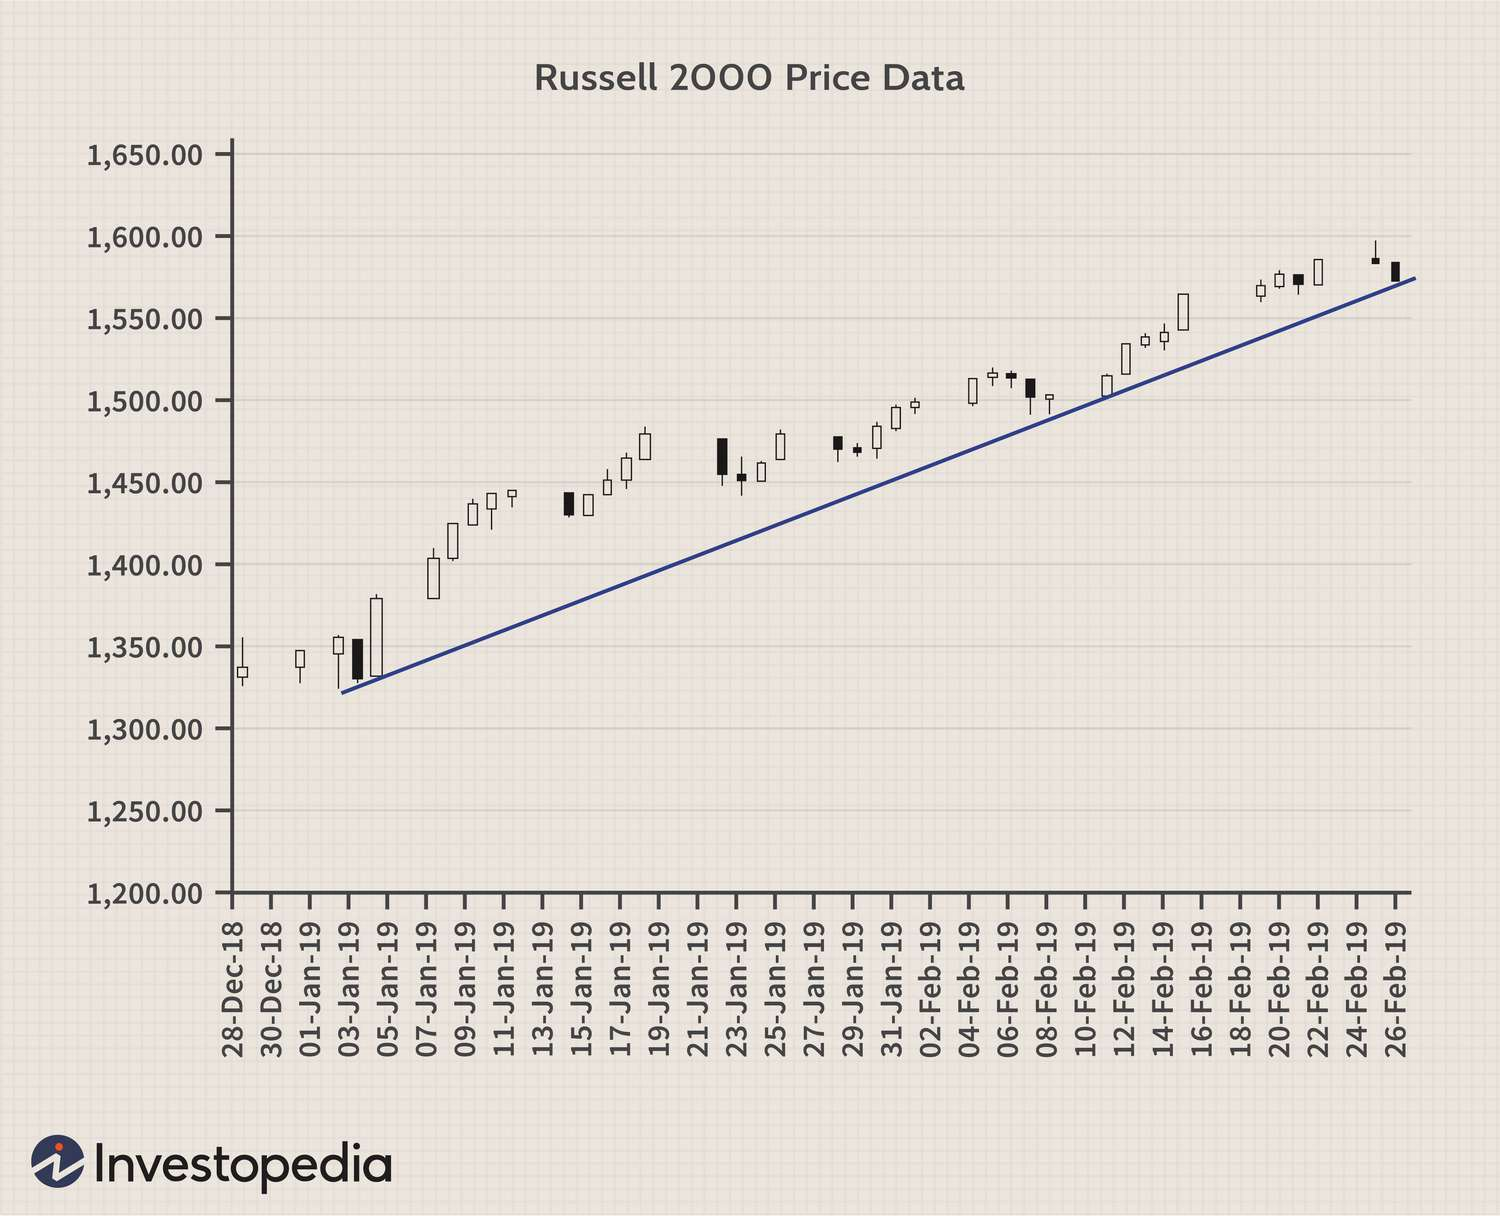
For best results, traders need to use the parabolic indicator with other technical trading systems, stating whether the term trending market is positive or not. You can use another technical indicator such as the Average Directional Index (ADX), a Moving Average (MA) or a Trendline.
To give you an example, traders may confirm a PSAR buy signal with an ADX reading more than 30 and a bounce for a long-term rising trendline.
Limitations of Parabolic SAR
The Parabolic SAR Trading System is always on. It is constantly generating signals, whether a quality trend is present or not. Therefore you will get many signals of poor trend. it is because no significant trend is present or generated after a signal.
Another issue is the reversal system. Reversal signals are also generated, regardless of potential reversals of the prices. the reason being that a reversal is generated when the SAR reaches up to the price due to the AF in the formula. Therefore a reversal signal might get a trader out of the trade, even when the price movement hasn’t technically reversed.
It is because of these limitations, that we recommended you to use PSAR with other indicators for the entering and exiting trades in the live markets.
Conclusion
The Parabolic SAR or PSAR is a helpful and one of the best tools for traders to set trade charts. If used to its maximum potential, one can make the most profits and protect against losses. overall, if you are a trader, you should definitely use it.