


In the vast world of financial markets, chart patterns are important tools for traders to enhance the decision-making process and identify possible trading opportunities. Among the most reliable and well-known patterns are double-bottom formations that help traders spot potential trend reversals in the market.
Double bottom patterns fashion themselves at the end of a downtrend, making potential long entries for buyers. It is a bullish reversal pattern characterized by two consecutive troughs followed by a price rally.
While identifying the pattern is important, confirming it with technical indicators such as Moving Average Convergence Divergence (MACD) is crucial and can enhance trading decisions.
In this article, we shall explore the basics of these reversal patterns and demonstrate how you can master them with MACD confirmation for potential profit opportunities and improve overall trading performance.
Let us begin!
What is a Double Bottom Pattern?
The double bottom pattern stands as an important concept in technical analysis, frequently observed as a common indicator of bullish reversal. This chart pattern, much like its less frequent relative, the triple bottom pattern (consisting of three consecutive troughs), indicates a possible change from a downward trend to an upward trend.
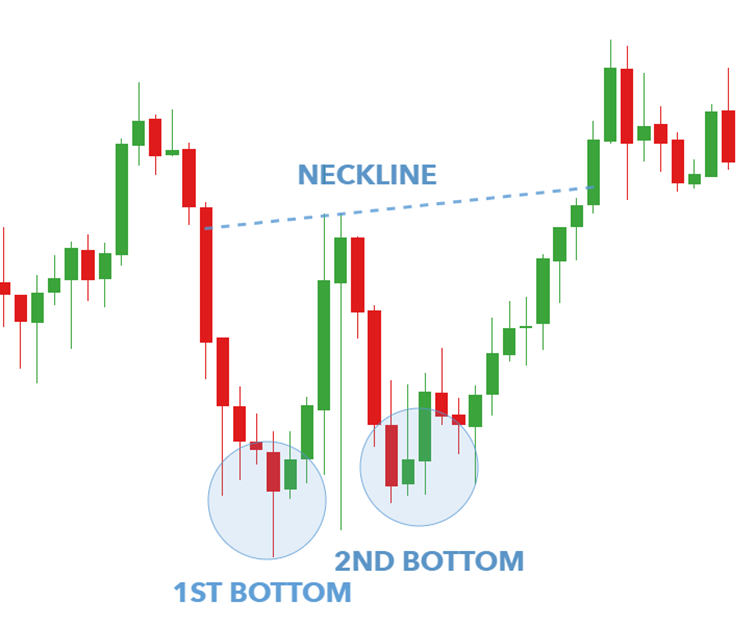
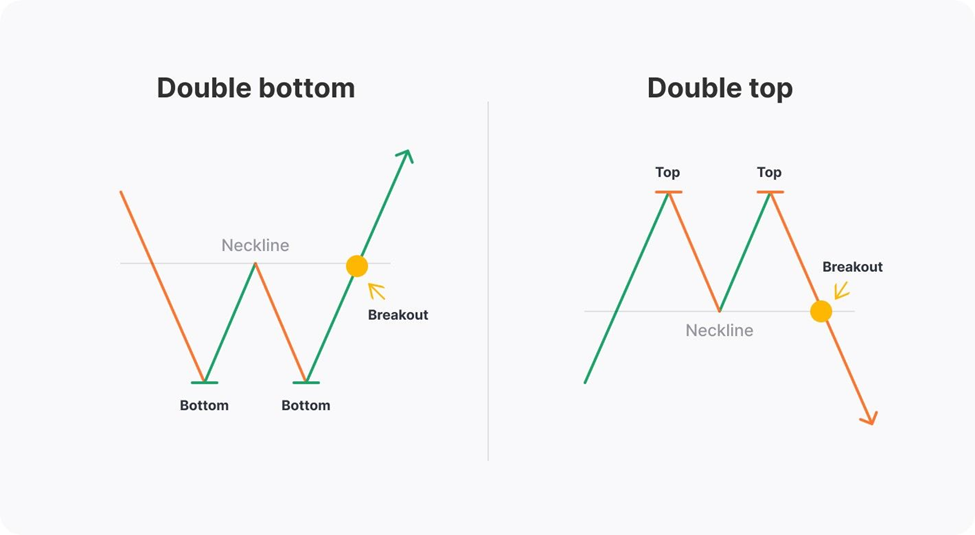
The double bottom formation is a bullish reversal pattern that occurs at the end of the downtrend. It consists of two lows (troughs), occurring at equal or approximately equal levels and with a peak between them. The double bottom formation creates a “W” shape on the price chart.
The price declines to a new low and then rises a little higher before coming back to the previous low. The price bounces off sharply from this area as sellers give up trying to drive the market to a new lower low to extend the downtrend. If the price breaks above the peak located at the highest point between the ‘bottoms’ resistance level, it indicates a bullish confirmation.
This breakout above the neckline serves as an indication for traders to consider establishing buy positions. Early detection of double bottoms can provide you with useful purchase signals that will enable you to profit from the anticipated upward price movement once the pattern is confirmed.
Similarly, the double top pattern forms at the end of an uptrend and signals a bearish reversal. It, therefore, has tops rather than bottoms. The first top indicates the continuation of the uptrend, while the second top indicates the weakness of the buyers.
The double top pattern consists of two tops, separated by a trough. It resembles the letter “M” on the price chart. The confirmation of the double tops happens at the key support levels between the two high points, not at a breach in the key resistance level. It is worth learning the psychology of both double bottom and top formations to understand how to differentiate between them.
Keep in mind that you cannot utilize a double top setup during a downtrend and a double bottom setup during an upward trend.
A double bottom formation in forex is not different from a double bottom formation in stocks, commodities, or cryptocurrencies. Therefore, after you learn this chart pattern, you’ll be able to utilize it in commodity, stock, forex, and cryptocurrency trading.
Key Characteristics of Double Bottom Chart Pattern
The following are important characteristics to recognize a double bottom chart pattern.
- Peaks or Valleys: The chart pattern should consist of two valleys (bottoms/troughs) in the case of double bottoms or two peaks in the case of double tops. In the case of double bottoms, the first bottom forms the initial support level, whereas the second bottom occurs slightly higher or at a similar price level.
- Neckline: This is a horizontal line that links the highs of the two valleys or the lows of the two peaks. The neckline plays a crucial role in identifying the trade’s entry and exit points. It serves as a support or resistance level and is a significant indicator for double bottom and double top patterns.
- Price Rise or Drop: There should be a sizable price decrease or increase between the two peaks or valleys. The price shift should be at 10-20% in order to identify the impending trend reversal.
- Volume: Volume is useful in assessing the level of interest amongst traders. The trading volume should always be higher during the formation of a pattern compared to normal trades because it would suggest a significant interest of traders.
Confirming Double Bottom Chart Pattern with MACD
After recognizing the pattern, it’s essential to confirm it. Technical indicators such as moving averages, Moving Average Convergence Divergence (MACD), RSI, and others can be used to confirm the double bottom pattern.
MACD consists of two lines – the MACD line and the signal line. The histogram represents the difference between the two lines. It is deployed to confirm trend reversals and identify possible entry and exit points. It can be used to further identify the double bottom pattern as well as show the momentum of the trend. When the MACD crosses above the signal line, it can indicate a possible reversal of the downtrend.
Confirmation Criteria with MACD
- Bullish Crossover: Look for a bullish crossover where the MACD line crosses above the signal line, suggesting a strengthening bullish momentum. Traders can use MACD to confirm the double bottom pattern by finding a bullish crossover between the two lines.
- Bullish Divergence: MACD helps in detecting the trend low. The likelihood of an early reversal and growth to the upper boundary increases with the length of time the indicator takes to reach the lower boundary. This is suggested specifically by the bullish divergence. Moreover, a bullish divergence between the MACD histogram and the price action also confirms the double bottom pattern. If the MACD histogram creates a higher low and the price makes a lower low, it indicates bearish momentum and possible trend reversal. So, traders should look for a bullish divergence on MACD to confirm that the price is possible to reverse.
- Confirmation of Volume: To verify the intensity of the reversal, examine volume in conjunction with MACD confirmation. The reliability of the signal is further strengthened by a spike in volume that coincides with the bullish crossover and positive divergence.
Trading Strategies Based on Double Bottom Pattern
The double bottom pattern is based on the principle of entering a market at the breakout of a neckline, which is a line that is drawn through the peak between two bottoms. The concept is the same for many chart patterns such as Quasimodo, head and shoulders, inverse head and shoulders, triple top, triple bottom, and double top patterns.
Entry
Traders can look for an entry point once the pattern is confirmed. In the case of a double bottom pattern, they can enter a long position when the price breaks above the resistance level.
Stop Loss
Establishing a stop loss is important to limit possible losses. Traders can place a stop loss just above the resistance level for long positions.
Take Profit
Traders should also establish profit targets for taking profits. One common way is to place a target according to the height of the double bottom pattern. It is equal to the distance between the troughs and the neckline and is placed just from the neckline. A trader can also use trailing take order if the market sentiment is bullish.
Exit Strategy
Traders can use the MACD for exit signals. They can exit when the MACD line crosses below the signal line.
Risk Management
- Assign 0.2-2% of your trading capital for each trade.
- If you are buying, place your stop loss just below the double bottom pattern’s lowest point; if you are selling, place it just above the highest point of the double tops.
- A minimum risk-reward ratio of 1:2 should be your goal, which means you should aim to make two dollars for every dollar you risk.
- Continuously monitor your trade, and adjust stop loss, and take profit level according to market conditions.
Conclusion
Mastering double bottom pattern trading strategy with MACD confirmation demands a detailed understanding of both technical analysis approaches. Traders can enhance the likelihood of profitable trades and capitalize on market trend reversals by merging the visual clues of the double bottom pattern with the confirmation indications offered by the MACD indicator. However, one must practice sound risk management and trade discipline to successfully navigate the complexity of the financial markets.


