

Double-top patterns are bearish reversal patterns, which can be seen at the top of an uptrend and indicate an impending reversal. They resemble the letter ‘M’ because of two equal highs, whereas double bottom patterns resemble the letter ‘W’ and signal a bullish reversal.
Both the chart patterns are generally formed after successive rounding tops and bottoms. Trading them is something that traders would want when they want to get in early on a trend reversal. They are formed when the market is about to turn the corner and shift the trajectory and trend that it has been on. Traders can use this information to change their trade or even reverse the position perhaps that they had been in when they see this type of chart formation.
Below we shall discuss what double chart patterns are, how to spot them on price charts, and how to trade them in a financial market.
What is a Double Top Pattern?
A double-top pattern is seen at the termination of a long bullish movement in a stock, currency pair, or other security. As such, it can form only in an uptrend because the buyers are successful in forcing the price action higher by making a series of higher lows and higher highs.
Its inability to stretch the bullish series begins the formation of the double-top pattern as the second peak isn’t considered a higher high, however, as an equal high. This weakness is then employed by sellers to push the price lower and remove previous gains.
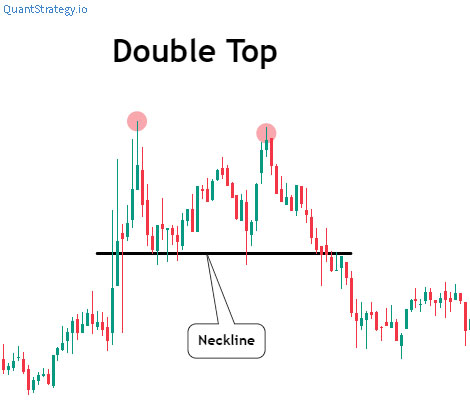
The chart below is an example of a double-top chart pattern.
Key Elements
- Uptrend: The price should trade in an uptrend for double tops to make sense. Keep in mind that this is a reversal pattern.
- Two equal peaks: It is hard to get two exactly same peaks. We can consider these two peaks equally high as long as the horizontal resistance, which capped the prior trend higher, halts the buyers once again.
- Neckline: This is the bottom part of the double tops that follows the first peak.
The double top formation is operative once the price breaks below the neckline. A market moves to lower lows from making the higher lows and higher highs, as the neckline break brings lower prices contrary to the neckline (the lowest point of the first pullback).
It is preferred that a certain time passes between the two peaks. If the second peak takes place almost immediately after the first peak (with a slight pullback), there’s a strong possibility that buyers would break above the first peak. The double-top chart pattern becomes a continuous pattern in such a case.
For this reason, the double top pattern, which is the most effective, is the one that has a certain time in between the two lows. It’s very important to wait for a neckline break before you enter a financial market to avoid the situation where double top formation becomes a continuous pattern.
What do Double Tops Indicate?
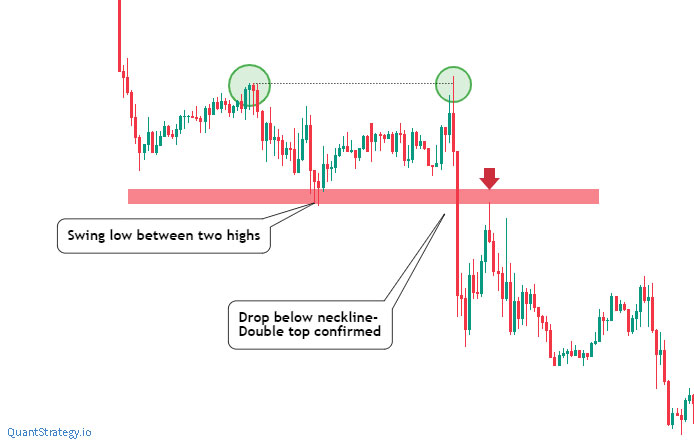
The double tops indicate a possible trend reversal for the traders. More specifically, they indicate a bearish reversal because of two reasons. As shown in the above chart, the first is, the price action meets resistance at the peaks and cannot move beyond the first peak on the second attempt. Next, the price falls below the previous swing low, forming a new swing low. These mark a downtrend instead of an uptrend. Downtrends create lower swing lows, that’s what is required by double-top patterns.
Spotting a Double Top
Double-top patterns aren’t very common in trading. But once rightly identified, they can be a powerful weapon for a trader. The USD/CHF chart below demonstrates a good example of the way to successfully counter a bullish trend.
The preliminary bullish move leads to huge profits of over 500 pips to the buyers. The price moves higher, in a nearly vertical fashion, without any significant pullback. The price rotates lower in the first more meaningful pullback following the first high.
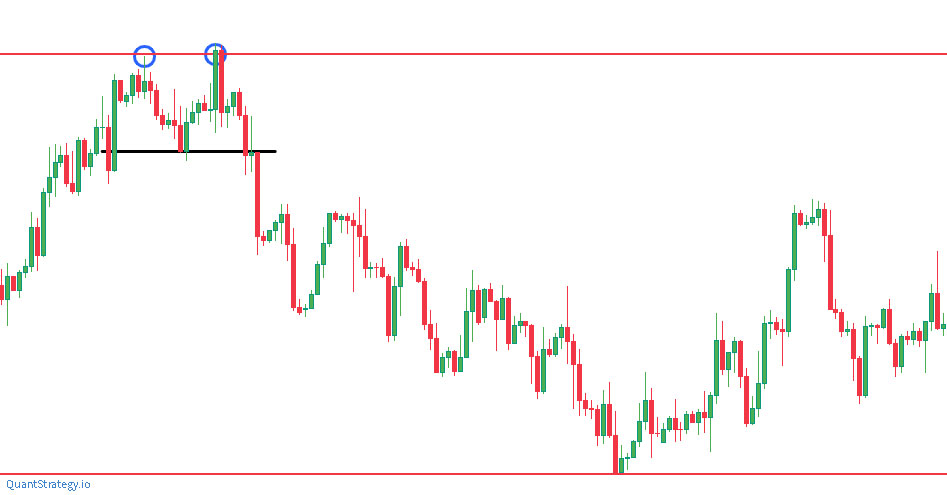
Then buyers can then organize and regroup another strike at the same level of horizontal resistance of 1.0050$ handle. However, they again fail at the same resistance that elicits a deeper pullback.
How to Trade Double Tops
There are two different ways to trade a double top.
Method 1
The first method to trade this chart pattern is to search for the neckline. You can enter the market with a nice sell order once the price action breaks through the neckline.
The below chart demonstrates the price breaking the neckline – this is the point for short traders to enter the market.
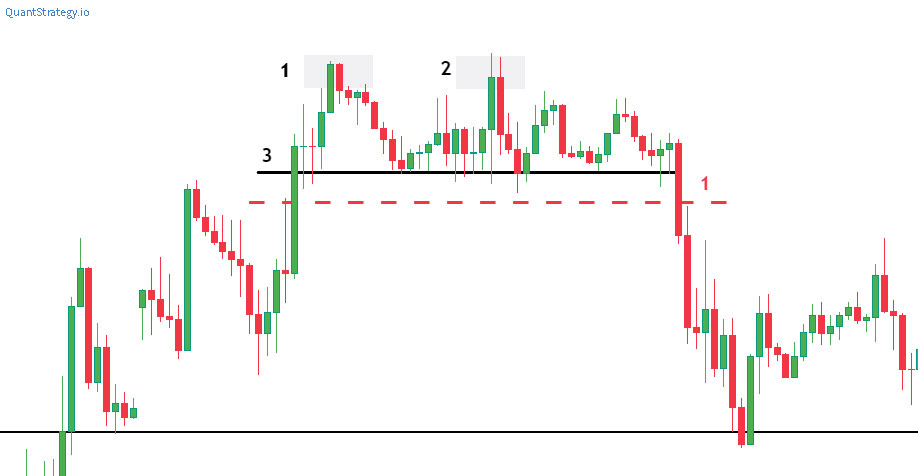
- First peak
- Second peak
- Neckline
- Beginning of the short trade is when the price breaks through the neckline.
So, the stop loss is placed above the double-top pattern. In case the price trades after this point, the pattern fails, and a trader doesn’t want to be in the financial market any longer.
Regarding the measurement of the profit target, it is calculated by taking the height of the actual chart pattern into consideration and extending that distance below the neckline.
The below chart shows the stop loss in red and task profit levels in green.
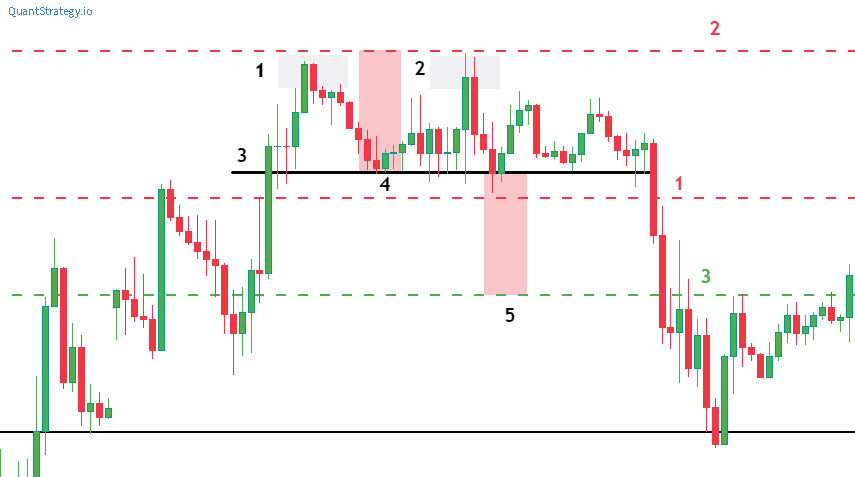
- First peak
- Second peak
- Neckline
- The pattern’s height (red shaded zone)
- Same distance as the pattern’s height (red shaded zone)
- Sort entry when the neckline is broken
- Stop loss is placed above the pattern’s peaks
- The profit target is placed at the same distance away from the height of the pattern down the neckline
Method 2
Another way to trade double top is to wait till the price trades below the neckline and then search for a selling opportunity on the neckline’s retest as broken support (below the neckline) becomes resistance.
The stop loss will be above the new resistance zone, and the profit target will remain the same as in the above example.
The below chart shows another way a trader can trade a double top. The entry is in orange, the stop loss is in red, and the take profit levels are in green.
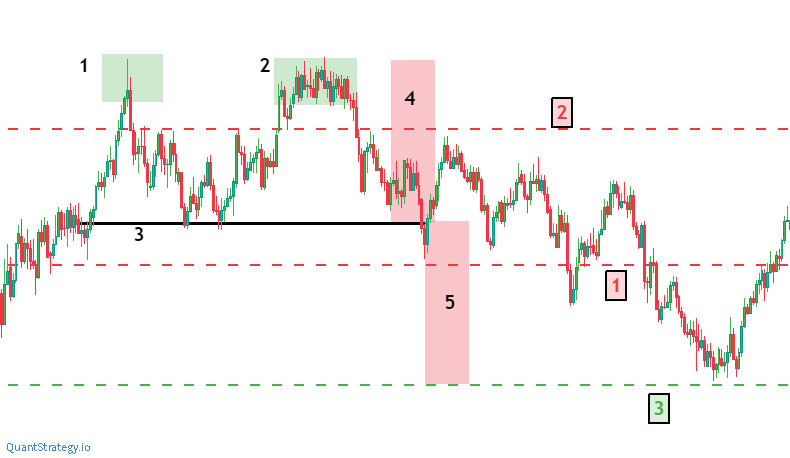
- First peak
- Second peak
- Neckline
- The pattern’s height (red shaded zone)
- Same distance as the pattern’s height (red shaded zone)1. Sort entry as resistance at the neckline’s retest2. Stop loss just above the resistance, following the price retesting the neckline
3. The profit target is placed at the same distance away from the height of the pattern down the neckline
Strengths & Weaknesses
A double-top chart pattern, similar to a double-bottom formation, is a powerful reversal pattern. One of its biggest capabilities is its efficiency along with the high probability of being productive in predicting a shift in trend direction.
The existence of a neckline equips the chart pattern with a well-defined magnitude to play against. The function of the neckline is that it outlines the risk and helps ascertain the take profit once the double top pattern is activated.
Conversely, its biggest weakness is that you counter what is, up till that point, a very strong trend. For this reason, there’s always a likelihood that this situation can eventually lead to a continuation of the bullish trend. As a result, traders should always consult chart patterns with other technical indicators like volume to confirm the reversal before entering the market.
Conclusion
Like any other chart pattern deployed in technical analysis, double top patterns aren’t guaranteed to accomplish and always welcome individual analysis.
To confirm the pattern, make sure all the essentials are present, including a bullish upward trend prior to the first high and rising trading volume when the support level is broken.
Moreover, as with all indicators, it’s important to confirm double tops with other features of technical analysis. Note, the more confirmed factors are there, the more reliable and robust a trading indicator is likely to be.


