

Pennant patterns are technical chart patterns that are used by traders to identify potential entry and exit points in the stock market. They consist of two converging trendlines, which form a triangle-like shape.
The pattern is considered bullish if the price action is moving up towards the apex of the triangle and bearish if it is moving down. Depending on whether it is a bullish or bearish pennant, traders can use different strategies to capitalize on the price movements.
What is the Pennant Chart Pattern?
For example, when trading a bull pennant pattern, traders can look for an entry point when the price breaks out above the upper trendline and then set their target at a level slightly higher than where the upper trendline was broken.
On the other hand, when trading a bearish pennant pattern, traders should look for an entry point when the price breaks below the lower trendline and then set their target at a level slightly lower than where it was broken.
How to Identify Pennant Chart Pattern formation
Pennant patterns are chart patterns that are used by traders to identify potential changes in the trend of a stock. They consist of two converging trendlines that form a symmetrical triangle, resembling the shape of a pennant.
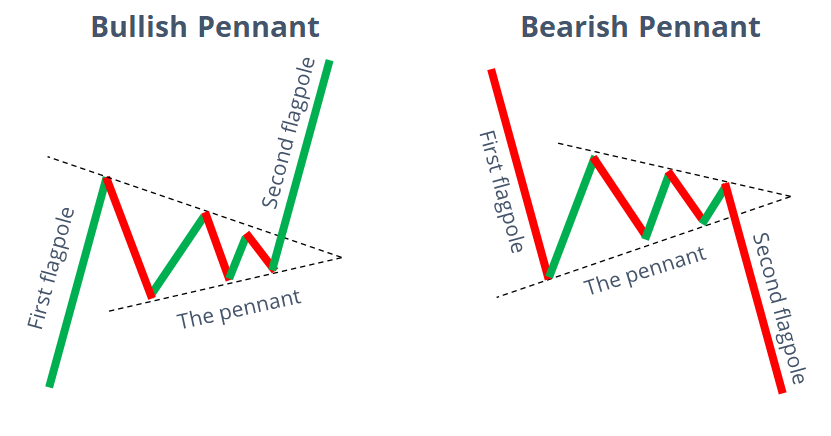
The Bullish Pennant pattern is formed when the price of a security moves up in an uptrend and then consolidates before continuing its upward move. A Bearish Pennant pattern is formed when the price moves down in a downtrend and then consolidates before continuing its downward move.
Traders can use these patterns to identify potential buy or sell signals as well as gauge how long they should hold onto their positions for maximum profits. By studying historical data, traders can recognize pennant chart patterns and use them to make educated trading decisions.
Pennant Patterns: Trading Bearish and Bullish Pennants
Bull Pennant
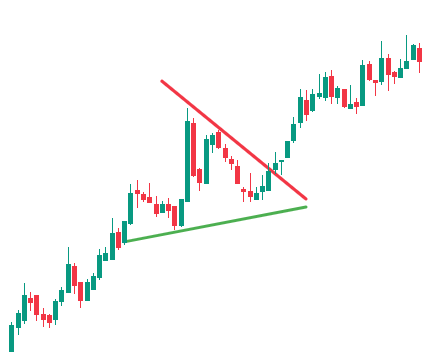
Bullish Pennants are continuation chart patterns that occur in strong uptrends. The Pennant is formed from an upward flagpole, a consolidation period, and then the continuation of the uptrend after a breakout. Traders look for a break above the Pennant to take advantage of the renewed bullish momentum.
Bearish Pennant
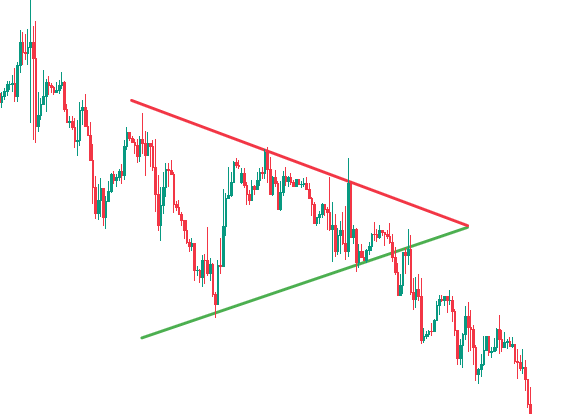
Bearish Pennants are simply the opposite of the Bullish Pennants. Bearish Pennants are continuation patterns that occur in strong downtrends. They always start with a flagpole – a steep drop in price, followed by a pause in the downward movement. This pause forms a triangular shape, known as the Pennant. There is then a breakout, and the downward movement continues. Traders look to enter short trades on a break below the pennant.
How to Trade Bullish and Bearish Pennants
Step One: Identify the Pattern Formation
The first step is to identify the pattern formation. This includes identifying an existing uptrend and the formation of a pennant after that uptrend has begun.
Step Two: Wait for the Breakout
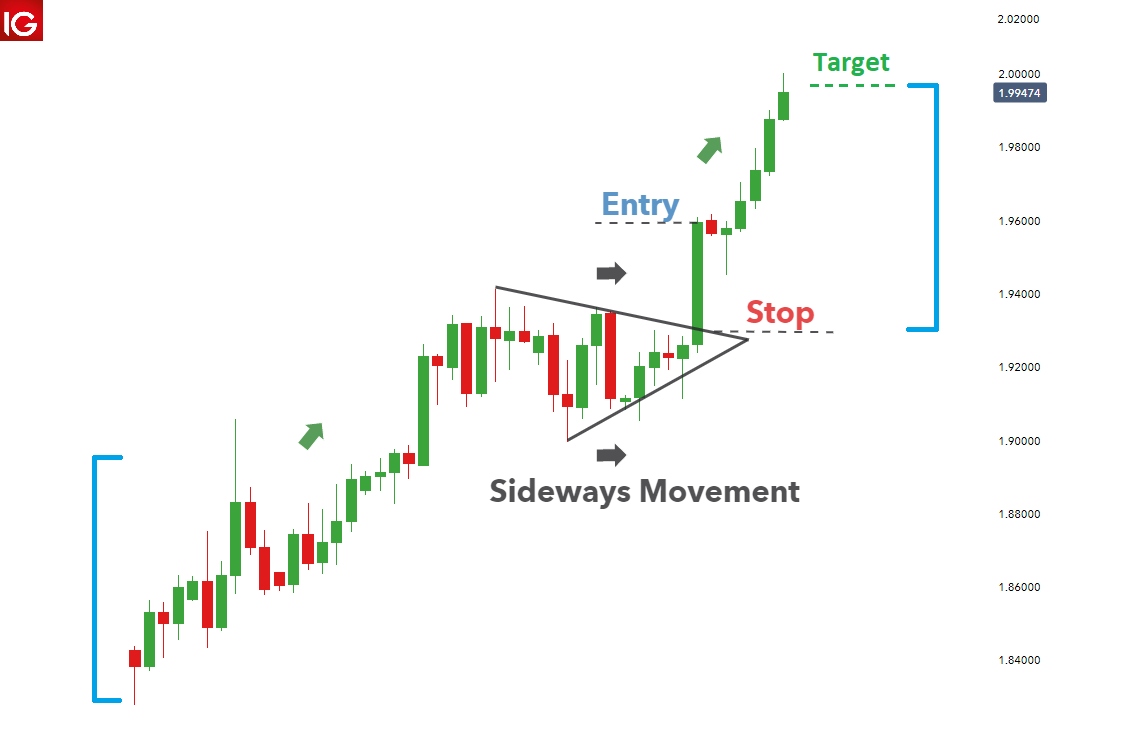
Once you have identified the pattern, it is important to wait for the breakout from consolidation before entering a trade. This breakout typically occurs to the upside, signaling a continuation of the uptrend.
Step Three: Enter a Trade
Once you have identified the breakout, you can enter a trade by buying the stock.
Stop Loss on Pennant Resistance
One way to place a stop loss when trading this pattern is to put it on pennant resistance. This will help you manage your risk and protect your profits in case the breakout does not occur or the market reverses course. Some traders prefer to place their stop losses below the breakout candle. Ultimately, it’s up to you to decide which method works for you.
Step Four: Exit the Trade
The final step is to exit the trade. This can be done by either taking profits at a predetermined level or by using a stop-loss order.
Take Profit Target
The profit target for this trade is up to the trader. Some traders aim for a profit target equal to the height of the uptrend leading into the pennant formation, while others may take a more conservative approach and aim for a smaller profit target. Make sure your target is realistic and in line with your risk management strategy.
Difference Between Pennants and Wedges
Pennants and wedges are both technical chart patterns used in technical analysis to analyze market trends and predict future price movements. While they may appear similar at first glance, there are some key differences between the two patterns.
Pennants
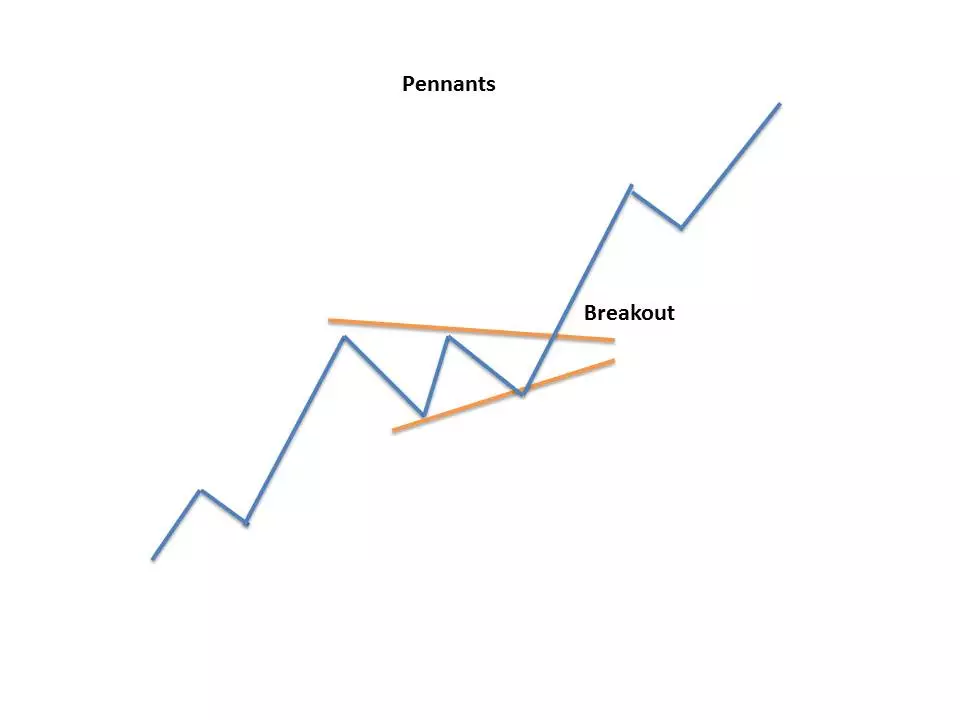
Pennants are continuation patterns that form when the price of an asset experiences a sharp price movement, followed by a period of consolidation where the price range narrows, forming a triangular shape. A pennant is typically identified by two converging trendlines, where the upper trendline represents a resistance level and the lower trendline represents a support level. A breakout from a pennant pattern usually signals a continuation of the prior trend.
Wedges
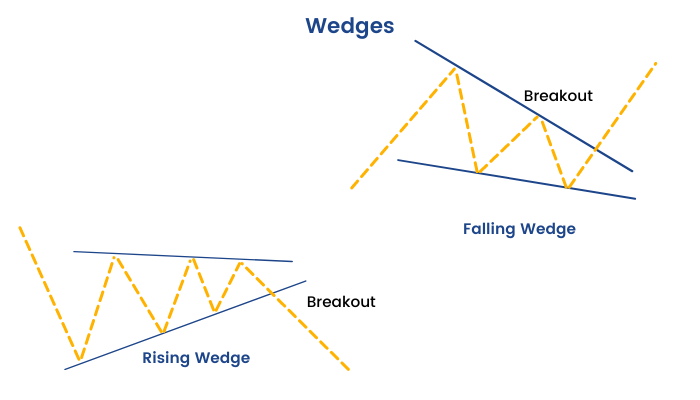
On the other hand, wedges are reversal patterns that can form either in an uptrend or a downtrend. They are characterized by two converging trendlines that move in opposite directions, either upward or downward. Wedges are generally classified into two types, rising wedges, and falling wedges. Rising wedges occur in uptrends and signal a bearish reversal, while falling wedges occur in downtrends and signal a bullish reversal.
In summary, pennants are continuation patterns that signal the continuation of the prior trend, while wedges are reversal patterns that signal a potential trend reversal.
What is the Difference Between a Bullish pennant and a Bull Flag?
Both bullish pennants and bull flags are bullish continuation patterns that are commonly used in technical analysis to predict the continuation of an uptrend. However, there are some key differences between the two patterns.
Bullish Pennant Patterns
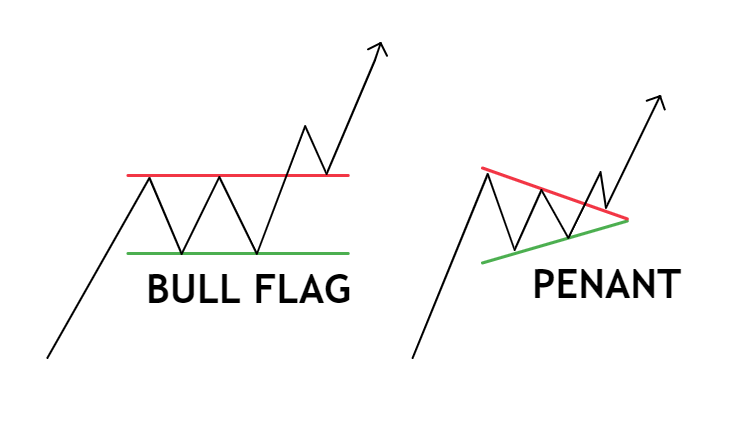
A bullish pennant is formed when there is a sharp price movement in an uptrend, followed by a period of consolidation, where the price range narrows to form a symmetrical triangle. In a bullish pennant, the trend lines converge to form a triangle with both the upper and lower trend lines being parallel to each other.
The upper trend line acts as resistance, while the lower trend line acts as support. A breakout from a bullish pennant occurs when the price breaks above the upper trend line, indicating the continuation of the uptrend.
Bull Flag
On the other hand, a bull flag is formed when there is a sharp price movement in an uptrend, followed by a period of consolidation where the price range narrows, forming a rectangular shape.
In a bull flag, the trend lines are parallel, with the upper trend line acting as resistance and the lower trend line acting as support. A breakout from a bull flag occurs when the price breaks above the upper trend line, indicating the continuation of the uptrend.
In summary, the main difference between a bullish pennant and a bull flag is the shape of the consolidation period. A bullish pennant forms a symmetrical triangle, while a bull flag forms a rectangular shape.
Tips for Trading Bullish Pennant Patterns
As a trader, you should fully understand the risks involved whenever you enter the market.
Remember: trading is a zero-sum game – every winner takes some losses from the losers.
Therefore, you must avoid taking significant risks that may lead you to a severe loss in the long run.
The safest way to trade pennants is to wait for confirmation before you enter a long position.
Firstly, you want to make sure when a breakout occurs, the volume also surges significantly.
Second, you want to wait for the pattern to fully form, and the breakout candle must close above the flag formation.
These two powerful tips will help you avoid false breakouts (or bull traps) that usually happen at the end of a sideways trend.
There’s always a chance that things could go wrong. So, you need to know how to protect your profits and cut your losses quickly when necessary.
Conclusion
There you have it – a complete guide to trading the bull pennant pattern. You can consider this pattern as a strong bullish signal, as it indicates that the market is likely to continue its upward trend.
A “reversal breakdown” can occur anytime if prices start to fall, breaking through the lower trend line. This signals that the market momentum is shifting to the downside and that prices will fall hard after a short pullback.
That’s all for now – We hope this will help you make profitable trades with this powerful formation.


