

If you’re a trader or investor, you’re likely familiar with candlestick charts. These charts display price movements for an asset over a certain period, and each candlestick on the chart represents a specific period. One type of candlestick pattern that traders pay close attention to is the Doji candlestick.
In this blog post, we’ll explain what a doji candlestick pattern is and how to trade it.
What is a Doji Candlestick Chart Pattern?
A doji candlestick is a candlestick pattern that occurs when the open and close prices of an asset are very close or even identical. This creates a very small or non-existent body on the candlestick, with a thin line extending from the top and bottom. Visually, a doji candlestick looks like a cross or a plus sign.
Types of Doji Patterns:
There are four types of doji candlesticks that traders commonly refer to:
- Common doji – where the open and close prices are equal.
- Long-legged doji – where the high and low prices are much higher and lower than the open and close prices.
- Gravestone doji – where the open and close prices are at the low of the session, and there are no lower shadows.
- Dragonfly doji – where the open and close prices are at the high of the session, and there is no upper shadow.
Each of these doji candlesticks has its significance and implications for traders.
How is a Doji Candlestick Pattern Formed?
A doji candlestick is formed when the opening and closing prices of an asset are nearly equal or the same, resulting in a candlestick with a very small or non-existent body and a thin line or “shadow” extending from the top and bottom of the candlestick, unlike other candlestick patterns. The length of the shadows can vary and provide additional information about market sentiment.
The formation of a doji candlestick pattern typically occurs when the market is indecisive, with neither buyers nor sellers able to take control. This can occur when there is a lack of news or events driving the market or when there is a balance between buyers and sellers.
The resulting doji candlestick can indicate a potential reversal or a continuation of the existing trend, depending on the context in which it appears.
There are four doji candlesticks: the classic doji, the long-legged doji, the dragonfly doji, and the gravestone doji. Each of these types has a specific formation and can provide different insights into market sentiment and potential price movements.
Doji Example
In the below chart, We can see long legged doji candle and gravestone doji candle patterns both.
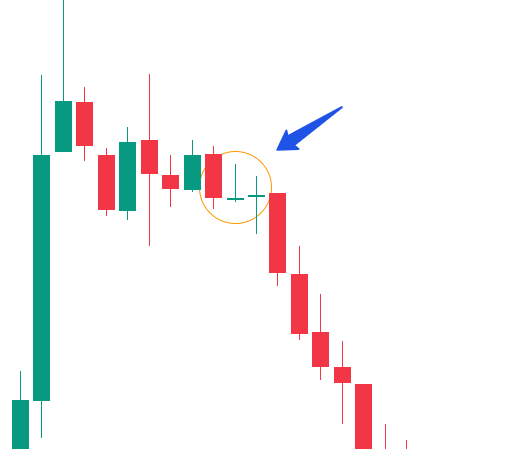
Looking at the doji candle pattern, the doji pattern suggests the selling pressure on an asset.
What Does a Doji Tell Traders?
A Doji candlestick pattern can tell traders several things, depending on the context in which it appears. Here are a few key insights that a Doji can provide:
- Indecision in the market – A Doji candlestick pattern suggests that there is a lack of clear direction in the market, with buyers and sellers being roughly equal in their strength and unable to take control.
- Potential reversal – When a Doji candlestick pattern appears after a prolonged uptrend or downtrend, it can suggest that the trend is losing momentum and may be about to reverse. In this case, the Doji may be interpreted as a sign of market indecision before a potential reversal.
- Continuation of the trend – On the other hand, if a Doji appears in the middle of a trend, it may suggest that the trend is likely to continue. In this case, Doji indicates that there is no clear shift in market sentiment and that the trend may continue in its current direction.
- Shift in market sentiment – The length of the shadows on a Doji candlestick can also provide valuable information. For example, a long lower shadow on a Doji may suggest that sellers pushed prices down during the session, but buyers ultimately pushed prices back up to the opening price. This can indicate a shift in market sentiment and potentially a reversal in the current trend.
In summary, a Doji candlestick pattern can tell traders about market indecision, potential trend reversals or continuations, and shifts in market sentiment. By understanding the context in which a Doji appears and considering other technical analysis tools, traders can use this pattern to make more informed trading decisions.
How to Trade With Doji Candlestick Patterns
Trading with Doji candlesticks can be a useful strategy for traders looking to make trading decisions based on technical analysis. Here are a few ways that traders can use Doji candlesticks in their trading strategy:
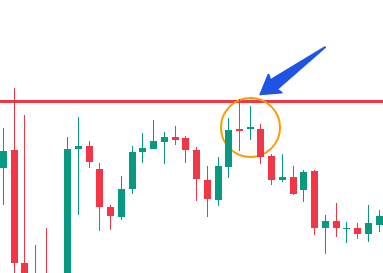
- Identify key support and resistance levels – Doji candlesticks can provide insight into potential reversals or continuations at key support and resistance levels. Traders can look for Doji candlesticks near these levels to identify potential trading opportunities.
- Consider the length of the shadows – As mentioned earlier, the length of the shadows on a Doji candlestick can provide valuable information about market sentiment. Traders can use this information to determine whether buyers or sellers are in control and make trading decisions accordingly.
- Wait for confirmation before entering a trade – Traders should not enter a trade based solely on a Doji candlestick. Instead, they should wait for confirmation from other indicators or price action before entering a trade. For example, traders may wait for a break of a key support or resistance level or confirmation from other technical indicators before entering a trade.
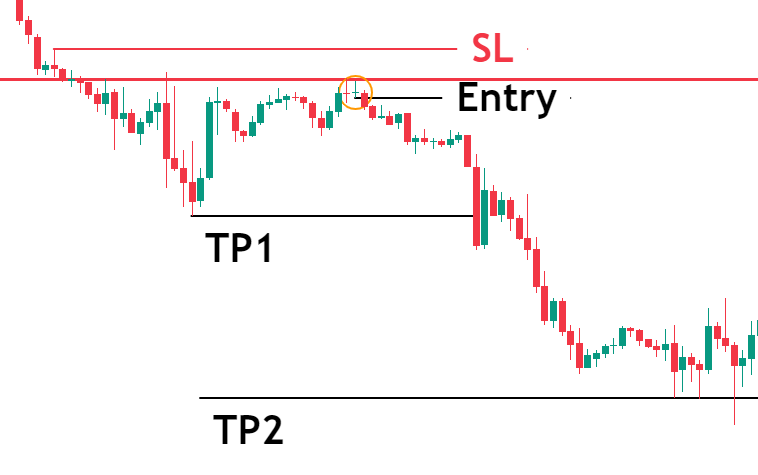
- Set appropriate stop-loss and take-profit levels – As with any trading strategy, it is important to set appropriate stop-loss and take-profit levels to manage risk and maximize potential profits.
Doji Candle vs. Hammer Candle: The Differences
Doji and Hammer candles are two different types of candlestick patterns that traders use to analyze price action and make trading decisions. Here are some key differences between the two patterns:
- Formation: A Doji candle is formed when the opening and closing prices are very close or equal, creating a small or non-existent body and long shadows. A Hammer candle is formed when the price opens lower, trades higher during the session, and then closes near the open, creating a small body with a long lower shadow.
- Interpretation: Doji candles indicate market indecision and can suggest a potential reversal or continuation of the existing trend. Hammer candles, on the other hand, indicate bullishness and can suggest a potential reversal or continuation of an uptrend.
- Context: The interpretation of Doji and Hammer candles depends on the context in which they appear. For example, a Doji candle may indicate a potential trend reversal if it appears after a prolonged uptrend or downtrend, while a Hammer candle may indicate a potential continuation of an uptrend if it appears in the middle of an uptrend.
Is the Doji Bullish or Bearish?
It is both a bullish and bearish pattern. It depends on the direction of the asset. If it forms doji during an uptrend, it is a bearish and vice versa.
Limitations of Doji Candlestick Patterns
While Doji candlesticks can provide valuable insights into market indecision, potential reversals, or continuations, there are also some limitations that traders should be aware of. Here are a few key limitations of the Doji pattern:
- Lack of clarity: While a Doji candlestick indicates that there is indecision in the market, it does not provide any clear indication of which direction the market may move next. This can make it difficult for traders to make trading decisions based solely on the Doji pattern.
- Need for confirmation: As mentioned earlier, a Doji candlestick should not be used in isolation to make trading decisions. Traders should wait for confirmation from other indicators or price action before entering a trade. This can reduce the number of potential trading opportunities based solely on the Doji pattern.
- False signals: Doji candlesticks can also provide false signals, especially in choppy or range-bound markets. In these situations, a Doji may not indicate a potential reversal or continuation of the trend, but rather just a temporary pause in the market.
- Importance of context: The interpretation of a Doji candlestick depends on the context in which it appears. For example, a Doji candlestick may indicate a potential reversal if it appears after a prolonged uptrend or downtrend, but may not be significant if it appears in the middle of a trend. Traders need to consider other technical indicators and price action to fully understand the significance of a Doji pattern.
Conclusion
In summary, while Doji candlesticks can provide valuable information about market indecision, potential reversals, or continuations, traders should also be aware of their limitations. A Doji pattern should not be used in isolation to make trading decisions, and traders need to consider other technical indicators and price action to confirm potential trading opportunities.


