When an asset is traded below its opening price but still rallies closer to its original price, it is referred to as a hammer in a candlestick charting pattern. The pattern creates a hammer-like candlestick whose lower shadow is around twice the original body.
Here, the real candlestick body shows the difference between the two prices i.e. opening and closing prices whereas the shadow highlights low and high prices during the period.
Understanding the Hammer Candlestick Pattern
A hammer on the price chart is responsible for showing a decline in the asset’s price, thereby demonstrating the market’s behavior to determine a bottom.
Hammers represent a potential capitulation from sellers to find a bottom, followed by a rise in price to point out a potential price reversal in the same direction.
The entire cycle occurs during one period, where there is a decline in the price followed by closure near the original one.
By nature, the hammer candlestick follows a bullish pattern that has:
-
Least or no upper shadow
-
Price always closes at 1/4th of the price range
-
The lower shadow is twice or thrice the original body’s length
-
Once identified, traders can derive the following meanings:
-
As soon as the market opened, the sellers influenced the price to decline
-
At a certain lower price, there was a huge buying pressure that pushed the price upward once again
-
High buying pressure influenced the market to close near its opening price.
In summation, it can be said that the hammer candlestick pattern is another form of reversal candlestick pattern it rejects low prices.
However, seeing bullish behavior doesn’t guarantee traders to stay in the market for too long.
Here are the reasons why…
Some Realities About Hammer Candlestick Pattern
- Hammer is a Retracement Against the Price Trend
Using a hammer pattern doesn’t mean that you are using a jackshit because it usually refers to retracement against the trend that goes from top to bottom on the price chart.
Coming across a hammer and following its direction means that you are moving against the trend, which in other words translates into being stopped and facing financial loss.
- Direction of the Trend Cannot be Found Out Through the Hammer Candle
For most of the traders, trend reversal occurs when the hammer forms. That’s not true.
It’s one of the biggest mistakes they make and suffer from losses.
The trend is, itself, a series of candles (100 or more) that form for a particular asset and move in a certain direction within a specified period.
Therefore, to determine a trend reversal, you have to figure out whether the asset’s price is increasing or decreasing over time.
Avoid looking at a single hammer candle to know the direction.
- Understand the Market’s Context not the Hammer
The term market’s context refers to the prevailing market conditions i.e. whether it experiences an uptrend, downtrend, has strong momentum, sideways, etc.
For instance, if there is an uptrend, chances are high that an asset’s price will increase, irrespective of the presence of a hammer.
On the other hand, there might be a hammer in the downtrend, regardless of the price going down.
Types of Hammer Candlestick
Multiple types of hammer candlesticks have some uniqueness from each other. Let’s have a look at them:
Bullish Hammer
Also called green hammer candlestick, it has a stronger formation of candles that show bulls or buyers’ ability to overpower bears or sellers over time.
Furthermore, it demonstrates how bulls got the opportunity to increase an asset’s price over the opening price.
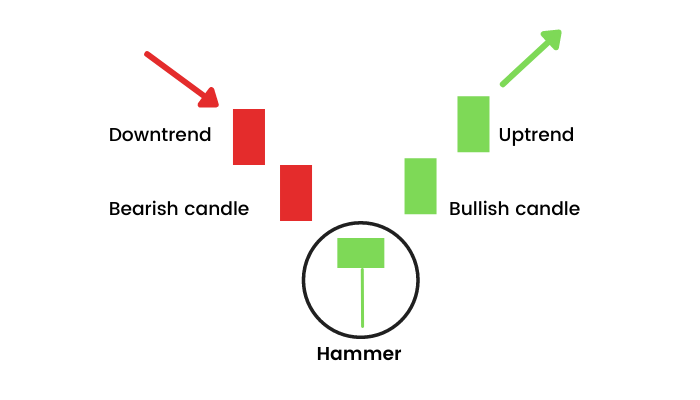
Bullish Hammer is divided into 2 categories:
-
Hammer Candlestick Pattern: Whenever the closing price of a security lies above its opening price, the hammer candlestick so formed is referred to as bullish. It indicates buyers’ control of the market conditions before the trading period ends.
-
Inverted Hammer Candlestick Pattern: When the opening price stays more than the closing price, it shows an inverted hammer pattern. The long wick shows buying pressure on the security that pushes the price upward but it eventually drops down before the candlestick closes. It’s a reverse bullish pattern that occurs after a downtrend.
Bearish Hammer
In contrast to the green hammer candlestick i.e. bullish hammer, the bearish hammer is red. It represents buyers’ ability to bear selling pressure without pushing the security price up (beyond the opening price).
-
Hanging Man Candlestick: When the opening price is greater than the closing price, it creates a red candle, which is also known as a hanging man. The wick indicates the market’s selling pressure leading to a potential reversal in the downtrend.
-
Shooting Star Candlestick: This bearish inverted hammer candlestick looks more like a regular inverted hammer but demonstrates bearish traits instead of bullish ones. These shooting star candlesticks occur after an uptrend, meaning that when the closing price lies below the opening price. Its wick depicts the end of the upward market movement.
How to Trade with the Hammer Candlestick Pattern?
Since this pattern shows a bullish reversal trend, it would be a bit easier for traders to identify potential buying opportunities.
In other words, a bullish hammer candlestick can efficiently help traders trace when the market will be profitable and when they should invest to earn a good ROI (Return on Investment).
It’s really important to implement this candlestick pattern properly to get satisfactory results. However, if traders don’t know much about it, below are some steps to follow while trading with the pattern:
-
Identify the Hammer: First and foremost, traders have to identify if the hammer candlestick is green or red. In other words, they have to identify the hammer’s nature since the color represents bullish or bearish candlestick patterns.
-
Validation: The identification process must be based on price trends i.e. whether the asset’s closing price lies above or below its opening price. The signals are stronger if they occur at the end of the downtrend. Previous price trends and actions should also be considered. High volume is a clear representation of strong buying pressure and increasing prices. In the end, don’t forget to analyze the support levels for surety.
-
Position of the Trade: After identifying the hammer, it would be easier to trace the entry points that usually lie above the hammer’s height. Traders can place a stop-loss order below the lowest price point of the wick to maintain control if the reversal doesn’t occur.
-
ROI: Last but not least, traders can claim their profits as soon as the price touches its set target. Here, they can apply multiple technical analysis tools and come up with the closest outcomes that could help them reach their goals before anyone in the race.
Here, traders have to remember that the above discussion is not enough to guarantee satisfactory results from the hammer candlestick patterns.
Many more technical indicators could assist in performing a proper financial analysis to ascertain if the hammer shows a bullish reversal pattern or bearish and whether they should invest or not.
Hammer Candlestick Pattern- Strengths and Weaknesses
Just like any other trading pattern, the hammer pattern also has some strengths and weaknesses. No technical tool is 100% accurate or guarantees profitability over time, it’s important to figure out whether the chosen hammer candlestick meets the criteria or not.
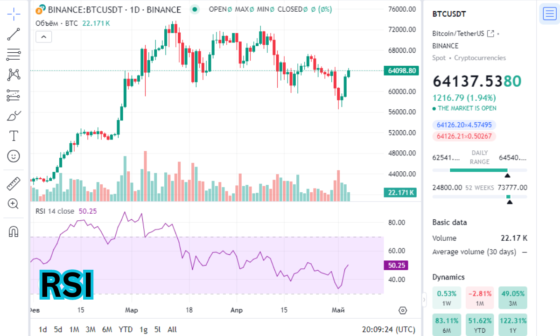
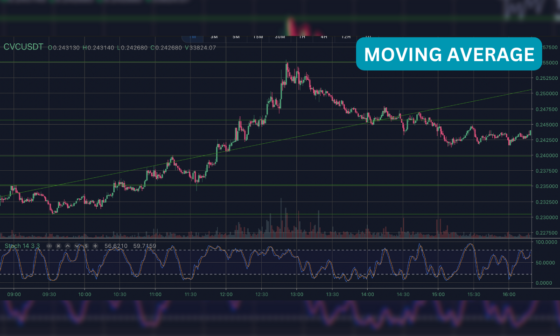
However, the hammer candlestick patterns can give better results when combined with other technical indicators or trading strategies like Fibonacci, trendlines, MAs (Moving Averages), RSI, and MACD.
Strengths
-
It’s easier to trace trend reversals with the hammer candlestick patterns.
-
Hammer patterns can give satisfactory results without considering timeframes i.e. traders can apply them on day trading as well as swing trading.
Weakness
-
Hammer patterns rely upon the context and do not guarantee trend reversals.
-
The results are not reliable enough to make a decision. Traders always have to use other technical tools and strategies to ascertain them.
Conclusion
While the hammer candlestick patterns cover a major part of trading and its analysis, there are still some gaps that may hinder traders from tracing possible trend reversals.
In other words, the hammer pattern is not a buy or sell signal because it always needs support from other technical indicators and analysis tools.
Through combined results, it could be easier for traders to create proper risk management plans and achieve their goals sooner or later.


