

Also referred to as the inverse hammer, the inverted hammer candlesticks are known for bullish reversal candlestick formation. Since it exists at the bottom of a downtrend, it demonstrates trend reversal concerning an asset’s price.
While the inverted hammer candlesticks are quite visible on the price chart, some traders still find it hard to identify the stop-loss placement and right entry level. They always have to struggle with making the right trading decisions.
This is where this guide comes in as it is going to solve this confusion with strong examples and facts and figures:
What is Meant by the Inverted Hammer Candlestick?
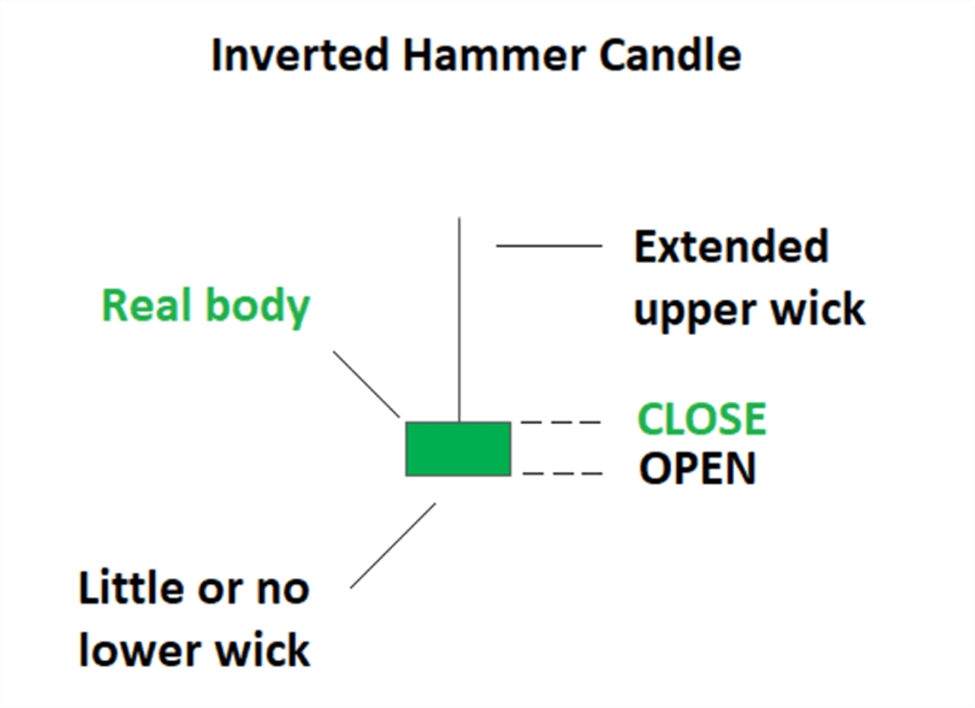
Visually, an inverted hammer candle contains a small real body with little or no lower wick and a relatively long upper wick. It signals bullish reversals by showing up at the end of a downtrend. Its extended upper wick shows upward price movement, which receives validation from subsequent price action (either as confirmation or rejection).
Here, the worth mentioning thing is that the inverted hammer is completely different from the shooting star. Even though they have similar appearances, their interpretations are different.
The shooting star exists at the top of an uptrend and shows bearish trends whereas, the inverted hammer occurs at a downtrend’s bottom and shows bullish trends.
How to Identify an Inverted Hammer Candlestick Pattern?
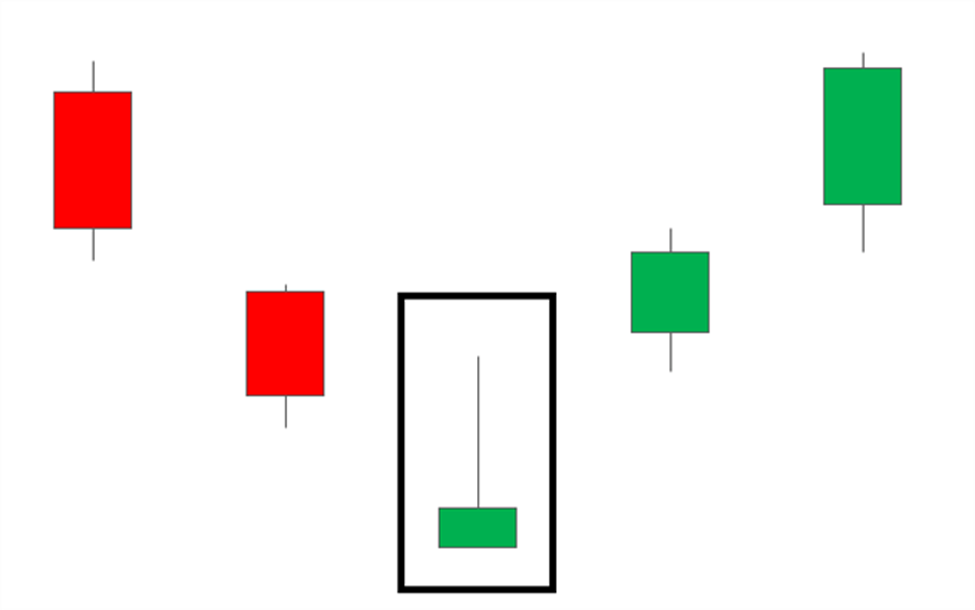
Apart from its small real body and upper and lower wicks, an inverted hammer candlestick can be easily identified by strong signals when it appears near to support levels.
What Does an Inverted Hammer Candlestick Pattern Show? Bearish or Bullish Reversal Trends?
As mentioned above the inverted hammer pattern shows bullish trends, it’s important to know why is it named so and how traders are supposed to respond to it. The fundamental reason lies in the prices that hesitate to show downtrends during the daytime.
In response, sellers try to push prices back to their original level at the time of opening and allow bulls to test the impact and reaction of the bears.
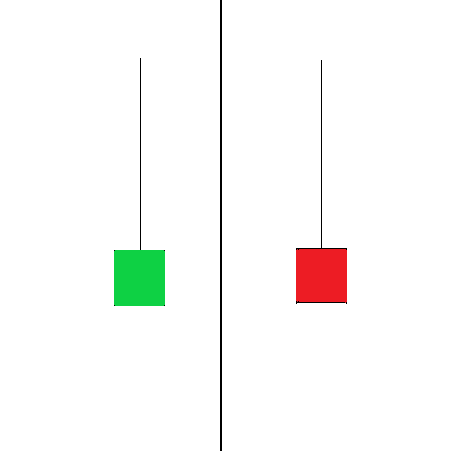
Red or Green Inverted Hammer Candlestick
A green bullish Inverted hammer appears when the open and the low are similar and demonstrate stronger bullish signals as opposed to a red inverted hammer when occurs against the same close and the low.
How to Use the Inverted Hammer Candlestick Pattern in Trading?
Traders can easily point out an inverted hammer pattern by its unique chrematistics- a small body, long upper shadow, and short or no lower shadow.
To make it clear, below is a price chart of a currency pair (GBP/USD 1D) that highlights how the inverted hammer candlestick pattern work on them and what are the key elements to consider.
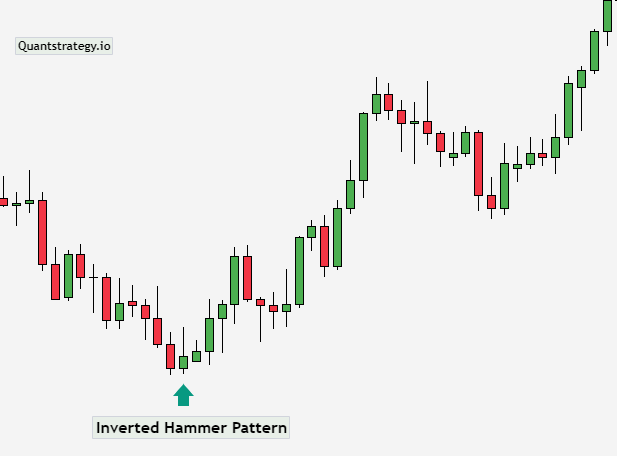
In the above example, the candle adjacent to the inverted hammer candlestick clearly states that the sellers were not so experienced to identify the right steps at the right time. Due to this, they lost control, and instead of taking a long position, they chose a short one as soon as the next candle opened.
BOTTOM LINE: Traders always have to follow these steps to track trends and initiate trades with the inverted candlestick:
-
Spot the downtrend.
-
Pick the inverted hammer candlestick pattern at the end of the downtrend, having a short lower shadow, a small body, and a longer upper shadow.
-
Track the trend and take immediate action (i.e. use other technical analysis tools, preferably MACD and RSI, to authenticate the reversal) as soon as the price reverses.
-
Decide to initiate a trade with a long buying position.
-
Spot the lower price for the asset and place a stop-loss order of the inverted candlestick.
Trade with Inverted Hammer Candlestick- Strategies and Technical Analysis Methods
When it comes to trading an inverted hammer candlestick, traders have to keep an eye on the inverted hammer candlestick patterns, especially at the bottom of the downtrends. Once identified, they can decide to enter a long buying position and initiate a trade.
Though, there is a high risk to get into a false trade, which is why, it’s crucial to verify the trend with other technical indicators beforehand.
To make this stage a bit easier, below are some effective and reliable technical analysis tools to validate a trend reversal:
1. Relative Strength Index or RSI
Referred to as one of the efficient trend reversal tools, RSI is responsible to identify oversold or overbought in a trade and indicating possible reversals.
When applied on an asset price chart, it helps traders to trace a crossover at the 30 level followed by the appearance of the inverted hammer candlestick pattern.
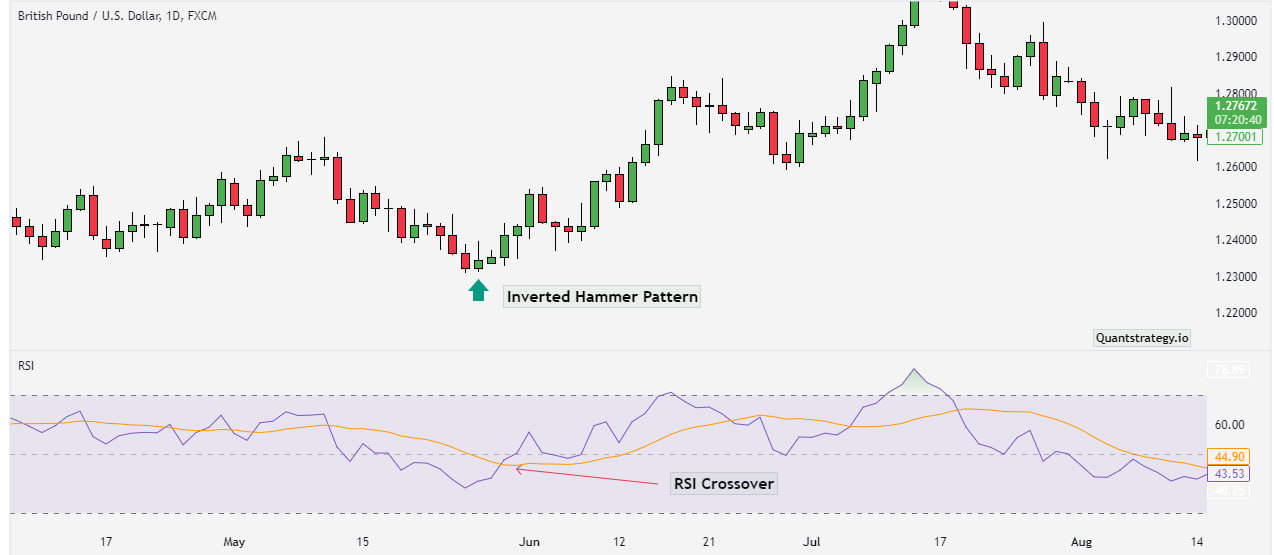
As the above GBP/USD 1D chart shows, there is a bullish reversal pattern happening with an inverted hammer candlestick. It can be easily identified by confirming the completion of a candle following the inverted hammer.
At this point, chances to grab maximum profits are higher as it allows traders to enter a position and place a stop-loss order at the lowest price level of the candle.
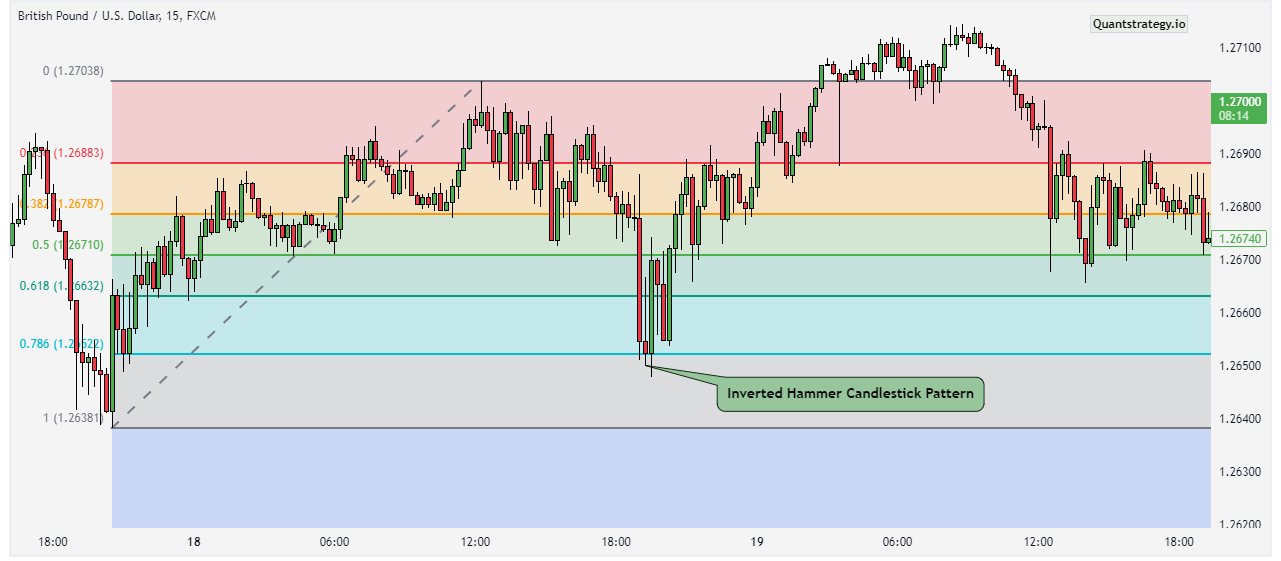
2. Fibonacci Retracement Levels
The next in line is Fibonacci retracement levels which give completely different results than the RSI. Here, the same example from above will be used with Fibonacci levels starting from the lowest levels.
As the chart says, the inverted hammer candlestick pattern occurs when the Fibonacci levels are at 38.2% level.
At this stage, it’s good for traders to make an entry as soon as the first candle appears and put a stop-loss order at the lowest of the inverted candlestick.
Pros and Cons of the Inverted Hammer Candlestick
Pros
-
Frequent charting candlestick patterns
-
Traceable/identifiable
-
Potential for high profits
-
Inverted hammer candlestick patterns offer good stop-loss placement opportunities below the lowest price level of the inverted candlestick
Cons
-
Higher risk in trading because traders used to buy assets at the end of the trend
-
Need to use other technical indicators to validate a bullish reversal pattern
Key Tips to Do Better in Trading with the Inverted Hammer Candlestick
-
Despite the bullish nature of the inverted candlestick patterns, it’s important to always analyze the market context before making any trade decisions.
-
Traders must use other technical analysis tools to bring authenticity to the results. Be it volume analysis, moving averages, or momentum indicators, their results must be considered to avoid getting into the trap of a false bullish reversal signal.
-
To make the most of the inverted hammer’s trading nature, traders should always figure out trading volumes, or else, they may have to deal with false signals.
-
Risk management is another significant aspect not to forget about. Bullish traders must know the amount of risk involved in every trade.
Conclusion
Even though the inverted candlestick pattern shows significant trading insights for investment decisions, it’s crucial to seek evidence from other technical indicators to authenticate the anticipated trading strategy.
Moreover, traders have to design effective risk management strategies to put stop-loss orders, implement position sizing efficiently and avoid potential losses.


