

No doubt, chart patterns are one of the important elements to monitor price actions. They not only work as a basis to anticipate price directions but also identify trading chart patterns for an asset.
One of such chart patterns is the triple top chart pattern that discusses bearish trends in detail. The triple top pattern is referred to as a reversal chart pattern that forecasts potential changes in trend directions i.e. from uptrends to downtrends.
To get into more details about the bearish reversal pattern, read ahead:
What is the Triple Top Chart Pattern
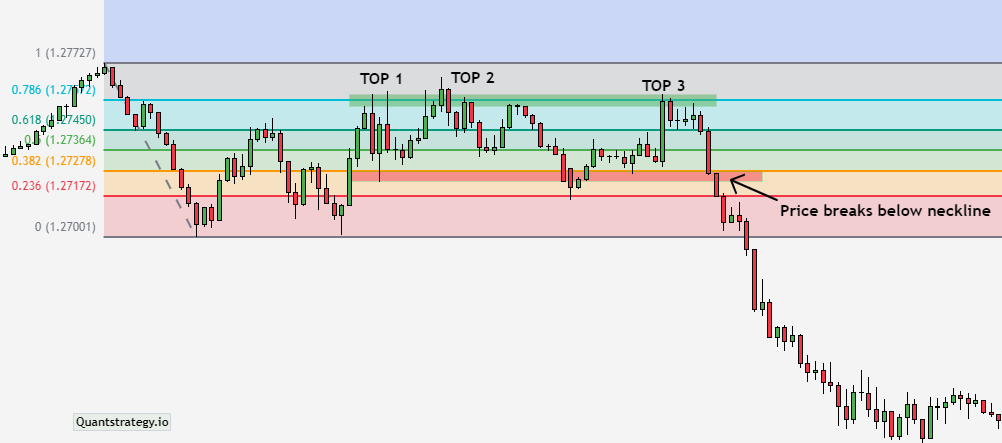
The triple top pattern comprises 3 swing highs, ending at the same level, along with 2 intervening swing lows.
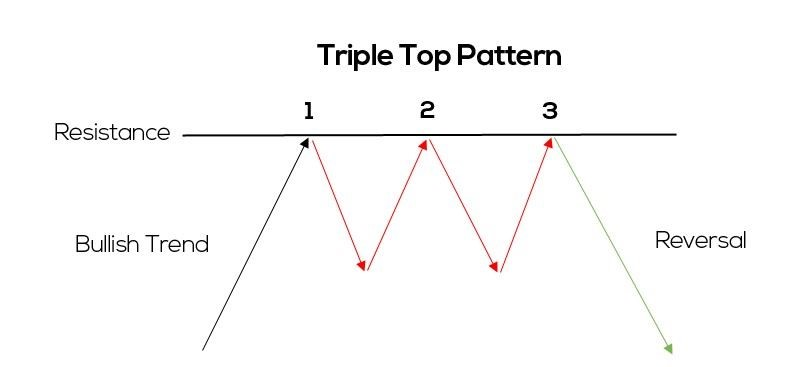
There is a straight line called the neckline that acts as a support and connects the two swing lows and breaks down from a certain point to complete the triple top chart pattern to predict a bearish move.
This triple bottom pattern happens right after an uptrend to check the highest level of price (thrice) before there is a bearish movement in the downtrend. As soon as the price level reaches the third peak and starts to fall, traders can expect to see a constant decline in an asset’s price, or in other words, a trend reversal occurs.
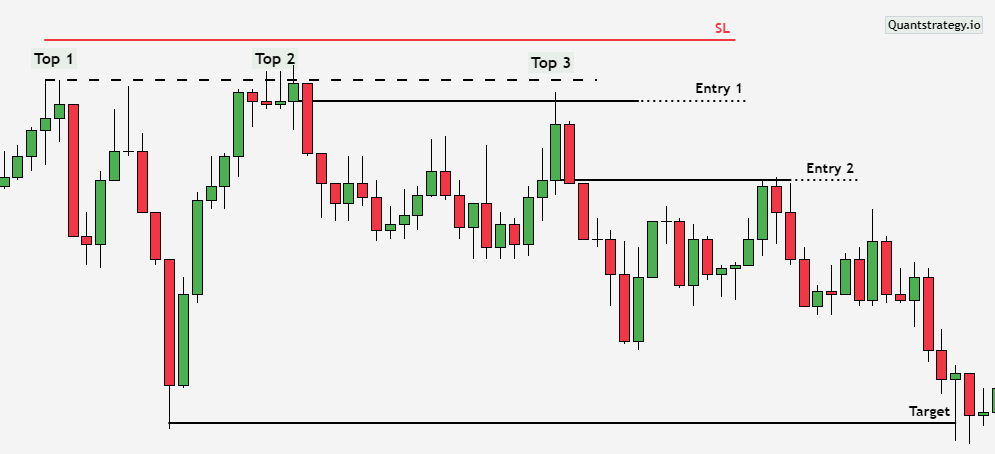
Moreover, the triple top chart is a good indicator for making timely entries into the market as it predicts where the trend would end and when is the right time to add a new market player.
With that being said, some analysts call the triple bottom pattern similar to the head and shoulders pattern and double top pattern.
Triple Top Pattern and Types of Trading
There are multiple trading strategies that have proven effects on the triple top chart patterns over time. Each of them is suitable for a particular situation or asset that traders have to be sure about. Let’s have a look at some of the widely used strategies:
Breakout Strategy
It enables traders to create a market sell order at the bottom of the breakout candlestick.
Retest Strategy
When the price decides to validate the broken support level to find a bearish reversal chart pattern before letting traders enter a short position.
Limit Order Strategy
In this strategy, traders can opt to place a limit sell order at the price breakout point with the intention of a retest.
Risk Management Strategy
It encourages traders to manage their risks efficiently by monitoring the trade market, setting up stop-loss orders and identify the right position sizes.
Tips to Maximize Profits with Triple Top Pattern
Traders can apply the following key techniques to see a significant rise in their profits:
-
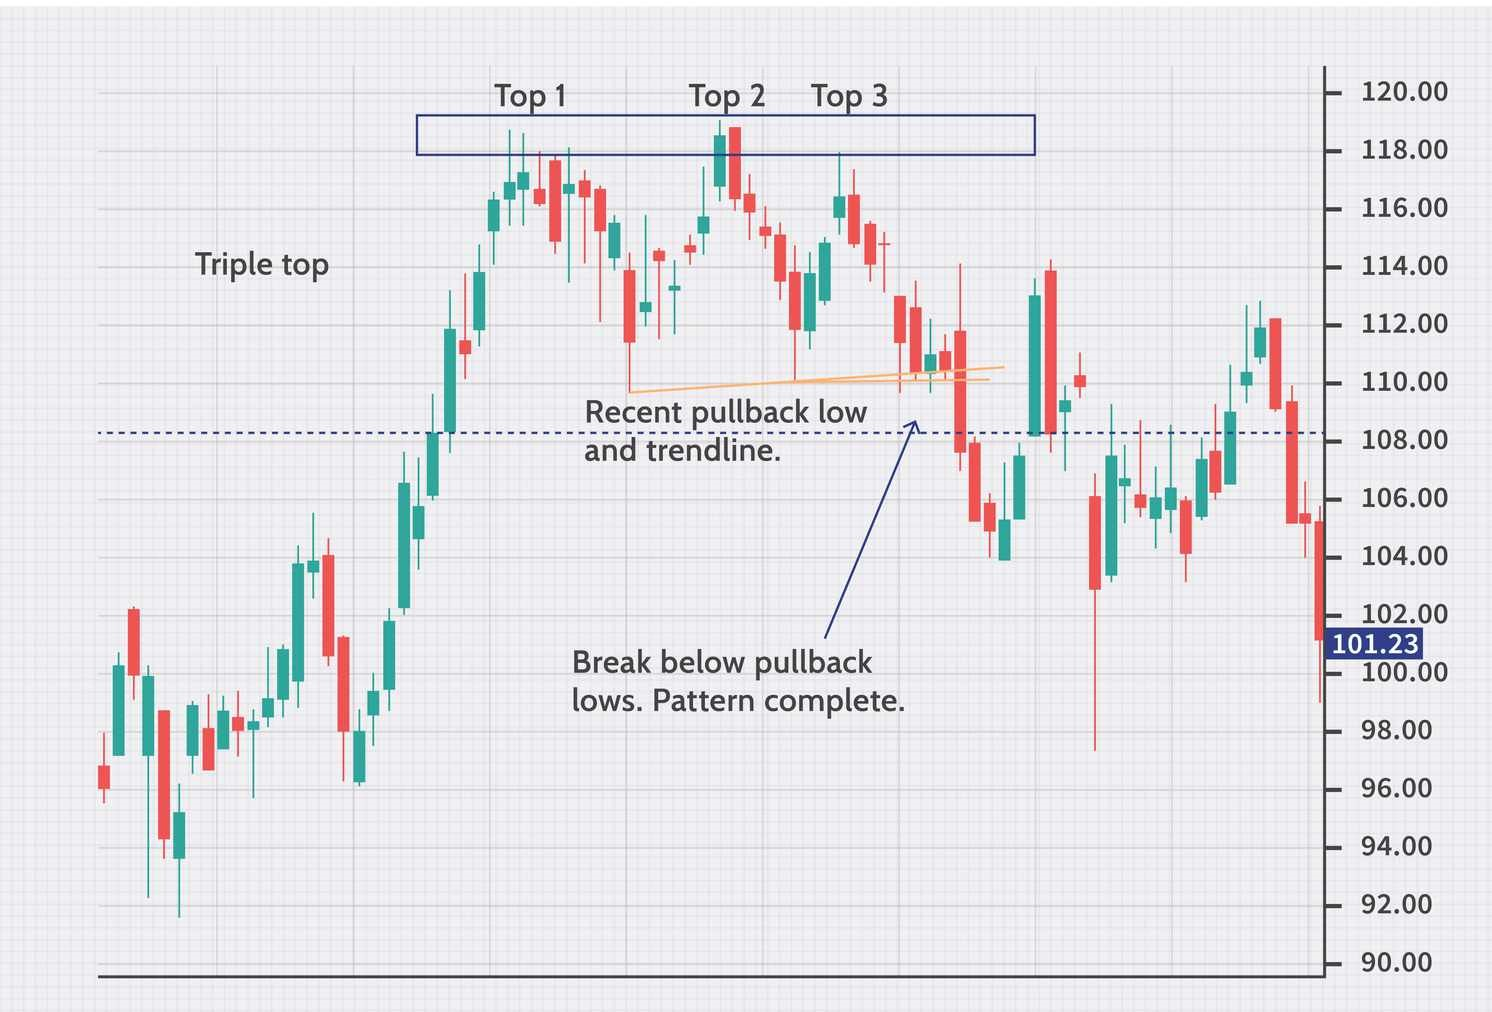
The triple top pattern needs confirmation that comes with a break under the support level.
-
Always monitor and analyze prevailing market conditions as well as key elements of the asset or stock.
-
Be sure to use a combination of reversal chart patterns and technical analysis tools to validate patterns and possibilities of a downtrend.
-
Take an immediate step, make a short entry, and find an opportunity to trade in the opposite direction.
-
Selection of the right risk management techniques is crucial to avoid risks and increase profits.
Key Rules to Identify a Breakout After the Chart Pattern
Below are some key rules that can help traders to identify a breakout after the triple top pattern:
-
There must be a clear breakout closure below the price support level.
-
The volume must be higher on the breakout to validate its strength.
-
Always use a momentum indicator like MACD or RSI for confirmation.
Factors Involved in Trading with the Triple Top Pattern
-
Moderate to low trading volume is ideal- so always monitor the volume of every peak.
-
Breakout volume must be high.
-
Analyze fundamentals of the traded asset or stock along with overall market scenarios.
-
Use technical analysis indicators like MACD or RSI to check momentum.
-
Apply a good risk management strategy like monitoring market situation, stop-loss orders or proper position size.
-
Check signals as to whether the chart pattern is reliable for a specific market or not.
Trading Strategies with Triple Top Chart Pattern
As mentioned above, it’s important to combine triple top pattern results with other technical indicators.
Traders only have to figure out which option they should go with, since there are multiple options available depending on the market situation and trading trends.
1. Triple Top Pattern and Moving Average Convergence Divergence – MACD
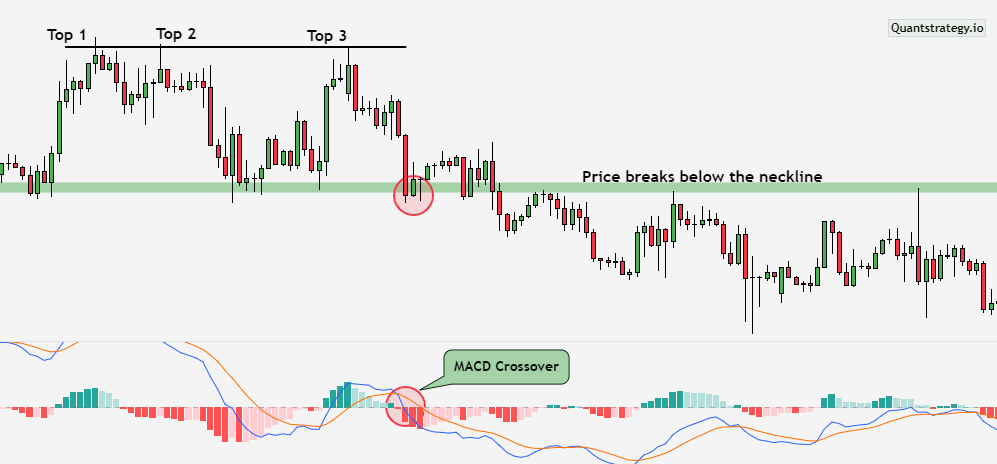
Referred to as a trend reversal chart pattern, MACD is capable of demonstrating some amazing and worthwhile aspects as to whether a trade is beneficial or not. Moreover, it is also responsible to confirm a change in momentum.
By using the above chart with an added MACD indicator, it will be easier to ascertain that the breakout, occurring before the neckline, is true.
The timing of the MACD crossover is the same when the price level breaks the neckline- thereby confirming the trend reversal.
2. Triple Top Pattern and Fibonacci Retracement Levels
The next worth considering technical analysis tool is the Fibonacci retracement which mentions the right time to make an entry into the market.
The below available example clearly shows the significance of using the 50% Fibonacci retracement level to enter a trade as soon as the breakout occurs.
Furthermore, traders have the chance to create a stop-loss order above the neckline and at the Fibonacci level so that the stop-order executes at the right time- instead of being triggered earlier.
In this example, traders may enter at the 50% Fibonacci retracement followed by placing a stop loss order at 61.8% level. This way, when the price level breaks the line and decreases after the retest at the 61.8% level, there will be a confirmation of the bearish reversal chart pattern. That’s when traders have to set the asset’s price at the right Fibonacci level or below Fibonacci extension levels.
Conclusion
In summation, it can be said that this reversal chart pattern is one of the reliable methods to confirm bearish trends. However, its results need support from other technical indicators like Fibonacci retracement levels or MACD to confirm the momentum and possibility of trend reversal.


