


Invented in the late 1970s, by Gerald Appel, the Moving Average Convergence Divergence or MACD is a momentum and trend oscillator/indicator. It demonstrates the variation in two moving averages or MA of a security price. The resultant line i.e. the MACD line appears as the result of subtracting the 26- period moving average from the 12-period exponential moving average (EMA).
Referred to as one of the best technical indicators for trading, moving average convergence divergence (MACD) is known for its flexibility and simplicity. It works as a momentum or trend indicator and also identifies signal opportunities to let traders know about their enter and exit trends.
Let’s get into a deeper conversation to understand and interpret the MACD in a better way:
What is MACD Indicator?
MACD revolves around a simple concept- it shows the difference between the 12-day and 26-day EMA (Exponential Moving Averages) of an asset. The closing prices of the respective periods are used to calculate their values.
If a trader wants to know more about MACD, it’s necessary to have complete knowledge about the signal line, which is a nine-period EMA (Exponential Moving Average) line. Its purpose is to generate buy and sell alerts in accordance with market trends.
How Does It Work?
Moving average convergence divergence shows past price trends therefore, is called the lagging indicator. In fact, it doesn’t go well to estimate or calculate stock prices/security prices that haven’t been quite active in the market or trading on unpredictable price variations. Nonetheless, financial experts still recommend looking at its bearish or bullish movement because of price strengthening and weakening trends. This eventually helps traders to identify entry and exit spots.
MACD Terminology
Below are some key terms that every trader has to know to understand MACD:
-
Moving Average: Shows an average of an asset price within a particular time period.
-
Exponential Moving Average/ Exponentially Weighted Moving: A type of moving average that focuses on recent data points.
-
Convergence: An indicator showing the movement of two moving averages (MA) towards each other.
-
Divergence: An indicator that demonstrates two moving averages in opposite directions.
Components of Moving Average Convergence Divergence (MACD) Indicator
There are 3 main components of the MACD indicator:
The MACD Line
When the longer moving average i.e. 26-period, is subtracted from the shorter MA (12-period), it generates a line called the MACD line. It determines the upward and downward momentum or the market trend. Considering the standard time periods, the MACD indicator is the result of subtraction between 12-period EMA and 26-period EMA. Both EMAs use closing prices for this purpose.
Formula:
MACD line = 12-day EMA – 26-day EMA
The Signal Line
This line is responsible to generate trade signals for MACD only. When the MACD moves above its signal line (EMA), it generates buying signals and vice versa. The aim of the signal line is to smoothen the sensitivity of the moving average convergence divergence line. For the signal line, the nine-day exponential moving average doesn’t always ensure accuracy but its combined analysis with the MACD line can help in various ways. It can highlight potential reversals and/or entry and exit points, particularly at the MACD chart’s extremities (far below or far above the zero line).
Formula:
Signal line: 9-day EMA of the MACD line
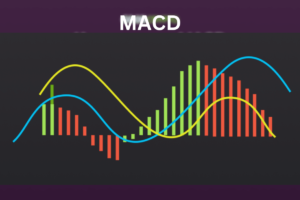
Histogram
It is the graphical representation of the distance between the two i.e. convergence and divergence of the signal line and the MACD line. When the latter crosses above the signal line, the graph shows positive trends and vice versa. Histogram immediately reacts to price changes. When the prices increase, the graph grows bigger and shrinks as price movement slows down. The main purpose of a histogram is to calculate fluctuation in price action.
Formula:
MACD Histogram: MACD line – Signal line
Methods to Use the MACD Indicator
Moving average convergence divergence is used to reveal changes in the direction and strength of an asset’s price trend, with respect to when they should enter or exit from a position. While there are multiple ways of interpretation, below are some of the widely used and trusted methods to take into consideration:
-
Crossovers
-
Divergences
-
Rapid rises/falls
MACD Signal Line Crossover
Typically, signal line crossovers have emerged as one of the reliable MACD signals to follow in trading. In a bullish crossover situation, the MACD line falls above the signal line (positive) and generates an approval for entry to start trading (also known as buy opportunity). On the other hand, a bearish crossover happens when the MACD line is below the signal line (negative). It shows a sell opportunity or signifies an exit point. The trends show up for a few days or weeks, based on the strength of the movement.
Here, the worth mentioning part is that irrespective of being helpful for traders, signal crossovers aren’t as reliable as they are thought of. It’s important to know their position on the chart to control the risks. For example, some traders don’t enter a position until they receive a confirmed cross above the respective line.
Centerline Crossovers
These types of crossover patterns have similar signal crossover patterns except that they revolve around the relationship between the zero/center line and the MACD line.
Example
When the moving average convergence divergence line falls above the centerline, it is a bullish signal. Whereas, a bearish signal is when the MACD line crosses from below the centerline. Moreover, bullish signals are generated when the MACD line moves up from below zero and the situation is the opposite in bearish.
Traders used to wait for confirmed crossovers above the zero line before they could decide to enter a position. This way, they have control over not getting into the wrong position or making an early entry.
In other words, crossovers are more accurate and reliable to conform the prevailing trends. If moving average convergence divergence falls above its signal line upon downside correction, it shows long-term uptrend and bullish confirmation. It is more likely to proceed with the uptrend.
On the other hand, when MACD crosses below the signal line after a high move, it refers to long-term downtrend and confirms a bearish situation for traders.
Rapid Rises or Falls
When the short-term moving averages act separately from the longer-term moving averages, they are more likely to signal an over-supply or over-demand of an asset- this situation is referred to as MACD rapid rises or falls.
Since moving average convergence divergence is a lagging indicator, traders are suggested to use other technical indicators such as the Relative Strength Index (RSI) to cross-check the trends.
Example
In MACD rapid rises or falls, the trends confirm that the instrument will return to their normal level after showing oversold or overbought states. When the results are combined with that from the RSI and other technical indicators, traders can get a clear picture about their buying or selling decisions.
MACD Divergence
As the name suggests, there is divergence between the MACD highs or lows and underlying assets’ high and low prices.
Example
In a bullish divergence, the MACD creates two falling lows that correspond with two high asset prices, thereby suggesting buying opportunities in spite of the decline in pricing. They are more likely to proceed with price reversals followed by bringing a visible change in the trend.
When it comes to a bearish divergence, the two MACD falling highs correspond with two rising highs of the instrument’s price, showing that irrespective of an increase in price, buying trends are not as favorable as expected. Bearish divergence during bullish trends is evident of weakness in the trend.
Some traders used to go for a less reliable trading technique- they choose to trade in bullish divergence, despite of negative trends, to take benefit from the change in the trend.
Divergence Fakeout
Financial experts identified multiple issues with trading divergence. To begin with, divergence may generate false positive signals i.e. possibility of reversal, which may not be true. The reason behind is frequent plunges and surges in an asset’s prices in response to market participants’ preference to go with the order flow. In fact, forecasts by divergence have lesser predictability, especially for reversals.
Therefore, it can be said that divergence tactics cannot assure accuracy in their results. Likewise, divergence trades are not as error-free as they claim in hindsight because previous data only revolves around successful divergence signals. Data related to failed divergence is not available for traders to understand flaws and potential risks associated with trading.
Zero-Cross Strategy
Traders get into a long position as soon as they see MACD line crossing from below the 0-line. Practically, it is a bullish signal that asks for some patience and consistency from the traders. On the contrary, when the same line crosses from the above, it is a bearish signal. It suggests traders to make the most of increasing downward momentum and falling prices.
Histogram bars are of great significance in both cases- the length of histogram bars demonstrate the strength of signals. Or in other words, strong signals make the prices flow with the trend.
MACD VS. Relative Strength
As discussed above, the relative strength index or RSI is designed to show the market trends of an asset. It is responsible to name the market as oversold or overbought based on recent price fluctuations. It works as an oscillator to evaluate average price changes over a specific time period.
Its default time is 14 periods with values ranging between 0 and 100, where 70 refers to overbought situation while 30 shows oversold in the market.
Major Difference
While exploring the difference between the MACD and RSI, one thing is quite certain- the moving average convergence divergence lines don’t show accuracy in overbought or oversold levels. Therefore, a trader or an investor has to study the direction and level of the signal/MACD lines instead of preceding price movements.
As a matter of fact, the RSI focuses on price changes with respect to the recent highs and lows in pricing while MACD explains relationship between two exponential moving averages. When results from both are combined, they create a clear picture of all technical aspects in the market.
Here, it’s important to remember that since both indicators work on different factors, they are more likely to give opposite estimations. For instance, the RSI may show overbought situation with an overextended trend on the buying side while moving average convergence divergence anticipates an increase in buying momentum. Either may generate divergence signal (for pricing) in relation to a potential trend change.
Drawbacks of Moving Average Convergence Divergence
Needless to say, nothing is perfect in the world and so does MACD. Like other indicators or oscillators, it possesses some risks and drawbacks that every trader must know before taking any action.
For instance, a reversal indicator may turn out to be false. In the above graph, the zero-cross image has a point that shows the MACD is crossing from below and going back again in a trading session. If a trader decides to make an entry when the MACD crosses from below, he/she would have to lose stock with the decrease in prices.
Analysis has proven that MACD cannot work efficiently in sideway markets. If an instrument’s prices move within an area between support and resistance, the MACD line would have no option but to shift to the zero line. The reason behind this is the unavailability of up or down trends that are crucial for good performance of moving averages (MAs).
In addition, since moving average convergence divergence works as a lagging indicator, the prices remain above the past lows until the MACD crosses from below. This situation enables traders to enter a long position than what they would have expected.
Limitations and Confirmation
Since moving average divergence delivers false positive signals i.e. the possibility of reversal that doesn’t happen in any way, it’s important to be careful while making a decision. In fact, divergence is incapable of forecasting all reversals or cannot predict real price reversals and make predictions for multiple reversals that never occur.
Now, to ascertain trading preferences, traders have to seek confirmation from trend-following indicators, like DMI or Directional Movement Index system, and the ADX or Average Directional Index. The latter has been designed to validate whether a trend is real. For confirmation of a trend in place, ADX shows a reading above 25 while a reading below 20 is evident of no trend in place.
Investors, using MACD divergences and crossovers, must cross-check with the ADX indicator before making a trade decision. For instance, despite the MACD demonstrating bearish divergence, trades can verify with the ADX whether the trend is higher in place. This way, traders can figure out when they should make an entry or exit from the market.
Pros and Cons of the Moving Average Convergence Divergence
Like other oscillators, the MACD tool comes with certain pros and cons that no one can ignore at any cost. To harness this trend indicator and momentum at maximum capability, it’s important to know where it falls short and where it goes higher:
Pros
-
Works as a momentum or trend indicator
-
Demonstrates potential buy/sell signals with the help of the MACD divergence and crossover
-
Enough to be used as a stand-alone analyst
Cons
-
Generates out false positive signals (indicates possible reversals that don’t occur)
-
Doesn’t forecast sufficient real price reversals
-
Cannot quantify the overbought or oversold condition
Conclusion
After the entire discussion, one thing is evident moving average convergence divergence is one of the widely used and valuable technical indicators. It verifies both market momentum and trends, which eventually help in determining trend reversals and trade entry/exit strategies.
Though, like other technical analysis tools, the MACD doesn’t always provide accurate results. It is responsible to generate misleading and false signals, especially during sideways price or weak-trending actions. Hence, to rectify this deficiency or mitigate risk, traders have to combine the MACD results with that of other analysis tools like the RSI indicator.


