Technical analysis is a popular method used in trading to predict future price movements based on past market data. One of the most commonly used technical indicators is the Average Directional Movement Index (ADX).
The ADX indicator is a powerful tool that measures the strength of a trend and helps traders determine whether to enter or exit a position. In this blog post, we will explore how to use ADX in trading strategies.
What is the Average Directional Index (ADX) Indicator?
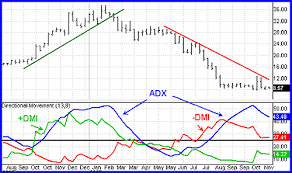
The ADX is a technical indicator that was developed by J. Welles Wilder in 1978. It is used to measure the strength of a trend in the market. The ADX values are calculated based on the directional movement of the market. The directional movement is calculated by comparing the current high and low prices to the previous high and low prices. The ADX ranges from 0 to 100, with values above 25 indicating a strong trend.
The ADX is made up of three lines. The ADX line itself, the Positive Directional Movement Indicator (+DMI), and the Negative Directional Movement Indicator (-DMI). The ADX line is the main line and is used to measure the strength of the trend. The +DMI and -DMI lines are used to determine the direction of the trend.
Using ADX in Trading Strategies
The ADX can be used in a variety of trading strategies. Here are some of the most common ways to use the ADX:
- Trend Identification
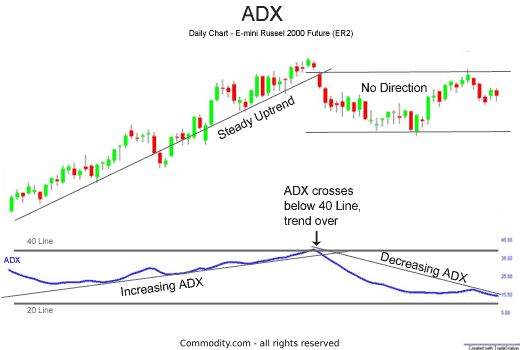
The ADX is commonly used to identify the strength of a trend. Traders use the ADX to determine whether a trend is strong enough to enter a position. If the ADX is above 25, it is considered to be a strong trend, and traders may look for opportunities to enter a position in the direction of the trend.
- Trend Confirmation
The ADX can also be used to confirm the presence of a trend. Traders can use the ADX in combination with other technical indicators to confirm the direction of a trend. For example, if the ADX is above 25, and the Moving Average is sloping upwards, it can be a confirmation of a bullish trend.
- Trend Reversals
The ADX can also be used to identify trend reversals. When the ADX starts to decline, it can indicate that the trend is losing strength. Traders can use this information to exit a position or look for opportunities to enter a position in the opposite direction.
- Trade Management
The ADX can also be used to manage trades. Traders can use the ADX to determine when to add to or exit a position. For example, if a trader is long a position, and the ADX is declining, they may choose to exit the position. If the ADX is increasing, they may choose to add to the position.
- Stop Losses
The ADX can also be used to set stop losses. Traders can use the ADX to determine the strength of a trend and set their stop loss accordingly. For example, if the ADX is above 25, a trader may set a tighter stop loss to protect their profits.
ADX Trading Strategies
Now that we have explored how to use ADX in trading, let’s take a look at some ADX trading strategies.
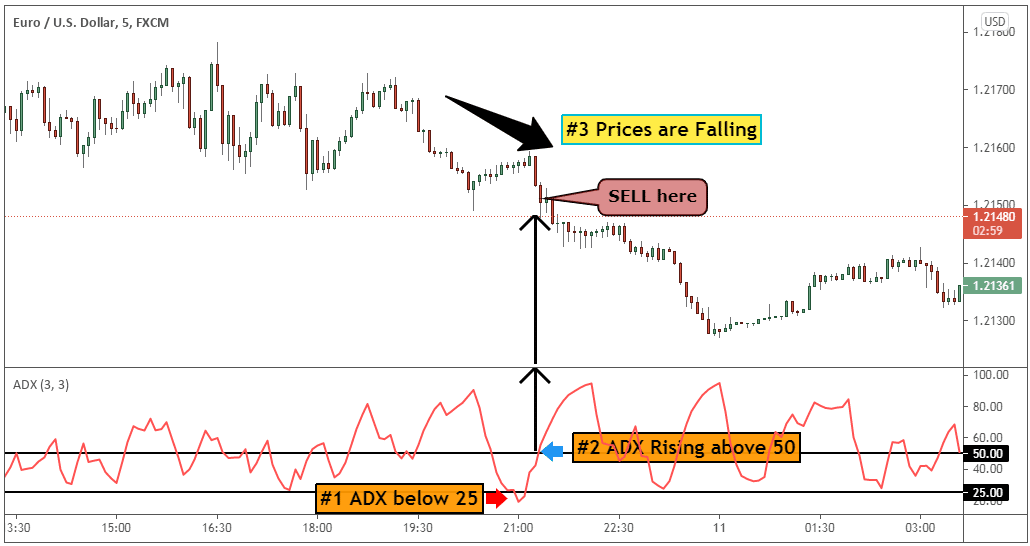
The most common ADX trading strategy is trend following. In this strategy, traders look for opportunities to enter a position in the direction of the trend when the ADX is above 25. Traders can use other technical indicators, such as Moving Averages, to confirm the direction of the trend. Stop losses can be set based on the strength of the trend, with tighter stop losses for stronger trends.
- Trend Reversals
Technical analysts can also use the ADX to identify trend reversals. In this strategy, traders look for opportunities to enter a position in the opposite direction when the ADX starts to decline. This strategy requires patience, as traders need to wait for the ADX to indicate a trend reversal. Traders can use other technical indicators, such as support and resistance levels, to confirm the trend reversal. Stop losses can be set based on the strength of the trend and the distance from the entry point.
- ADX Breakout
The ADX breakout strategy involves waiting for the ADX to break above a certain level, such as 30 or 40. This indicates a strong trend and can be a signal to enter a position in the direction of the trend. Traders can use other technical indicators, such as MACD, to confirm the direction of the trend. Stop losses can be set based on the strength of the trend and the distance from the entry point.
- ADX Divergence
The ADX divergence strategy involves looking for divergences between the ADX and price action. If the ADX is trending downwards while prices are moving upwards, it can indicate a potential trend reversal. This can be a signal to enter a position in the opposite direction. Traders can use other technical indicators, such as Moving Averages, to confirm the trend reversal. Stop losses can be set based on the strength of the trend and the distance from the entry point.
Combining ADX with Other Indicators
While the ADX can be a powerful tool on its own, it can also be combined with other technical indicators to provide traders with even more valuable insights into the market. Some commonly used indicators that can be combined with the ADX include Moving Averages, Bollinger Bands, and Relative Strength Index (RSI).
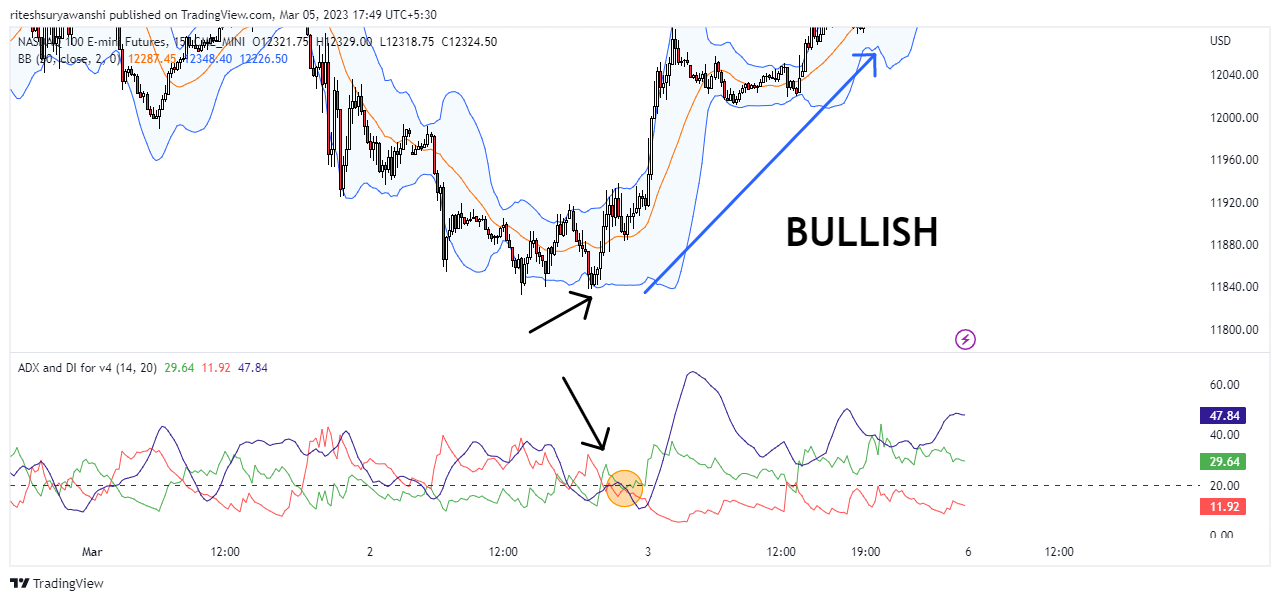
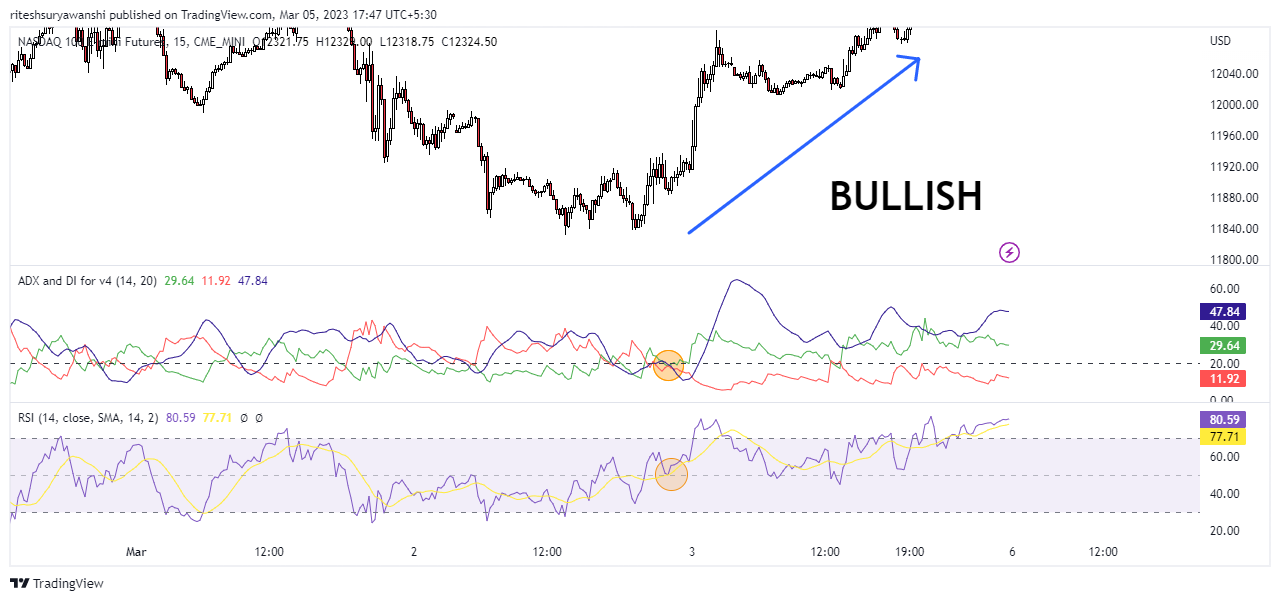
By combining the ADX with other indicators, traders can get a more complete picture of the market and make more informed trading decisions. For example, combining the ADX with Moving Averages can help traders identify the direction of the trend while combining the ADX with RSI can help traders identify potential overbought or oversold conditions.
However, it is important to remember that no single indicator can provide all the information needed to make profitable trades. Traders should always use a combination of indicators and other analysis techniques to confirm their trading decisions and manage risk appropriately.
The ADX Formula and Trend strength:
Due to the various lines in the ADX indication, a series of computations are needed.
+DI=(Smoothed +DM)×100 ATR
-DI=(Smoothed -DM)×100 ATR
DX=(∣+DI − -DI∣)×100 ∣+DI + -DI∣
ADX= (Prior ADX×13)+Current ADX 14
where:
+DM (Directional Movement)=Current High−PHPH=Previous High
-DM=Previous Low−Current Low
CDM=Current DM
ATR=Average True Range
Trend strength is a crucial concept in technical analysis, and the ADX is one of the most widely used indicators for measuring it. The ADX measures the strength of a trend by calculating the difference between two directional movement indicators (DMI): the positive directional movement indicator (+DMI) and the negative directional movement indicator (-DMI).
A high ADX value indicates a strong trend, while a low ADX value indicates a weak trend. Traders can use this information to make more informed trading decisions, such as entering positions in the direction of a strong trend or waiting for confirmation of a trend before entering a position.
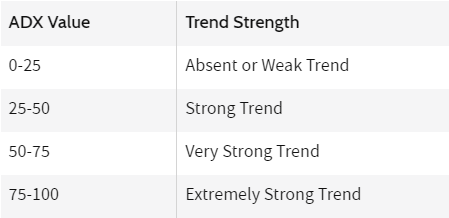
It is important to remember that trend strength can change quickly in the market, and traders should always be monitoring the ADX and other indicators to adapt their trading strategies accordingly.
Advantages and limitations
The ADX can provide traders with valuable insights into the direction and strength of a trend, but it also has its limitations. In this section, we will discuss some of the advantages and limitations of using the ADX in trading strategies.
Advantages of Using Average Directional Movement:
Identifying Strong Trends: The Average Directional Movement Index can be very effective in identifying strong trends in the market. A high ADX value indicates that the market is trending strongly, while a low ADX value indicates that the market is ranging. By identifying strong trends, traders can enter positions in the direction of the trend and potentially profit from price movements.
Managing Trades: The Average Directional Movement can also be used to manage trades by setting appropriate stop losses based on the strength of the trend. Traders can use the ADX to determine the distance from the entry point at which they should set their stop loss. For example, if the ADX is indicating a strong trend, that is 25-50, traders may set their stop loss at a larger distance to allow for potential price fluctuations.
Lagging Indicator: The ADX is a lagging indicator, meaning that it is based on historical price data. While this may seem like a disadvantage, it can be an advantage in some cases. By waiting for the ADX to confirm a trend, traders can avoid false signals and make more accurate trading decisions.
Limitations of Using ADX:
False Signals: The ADX can sometimes produce false signals, particularly in ranging markets. A low ADX value can sometimes indicate a weak trend, but it can also indicate a ranging market. This can lead to false signals and potentially losing trades.
Lagging Indicator: While the lagging nature of the ADX can be an advantage in some cases, it can also be a disadvantage in others. By the time the ADX confirms a trend, the price may have already moved significantly in that direction, leading to missed opportunities.
Not Suitable for all Market Conditions: The ADX is most effective in trending markets and may not be as effective in ranging markets. In a ranging market, the ADX can produce false signals and may not provide traders with accurate information about the direction of the market.
Trend Direction and Crossovers
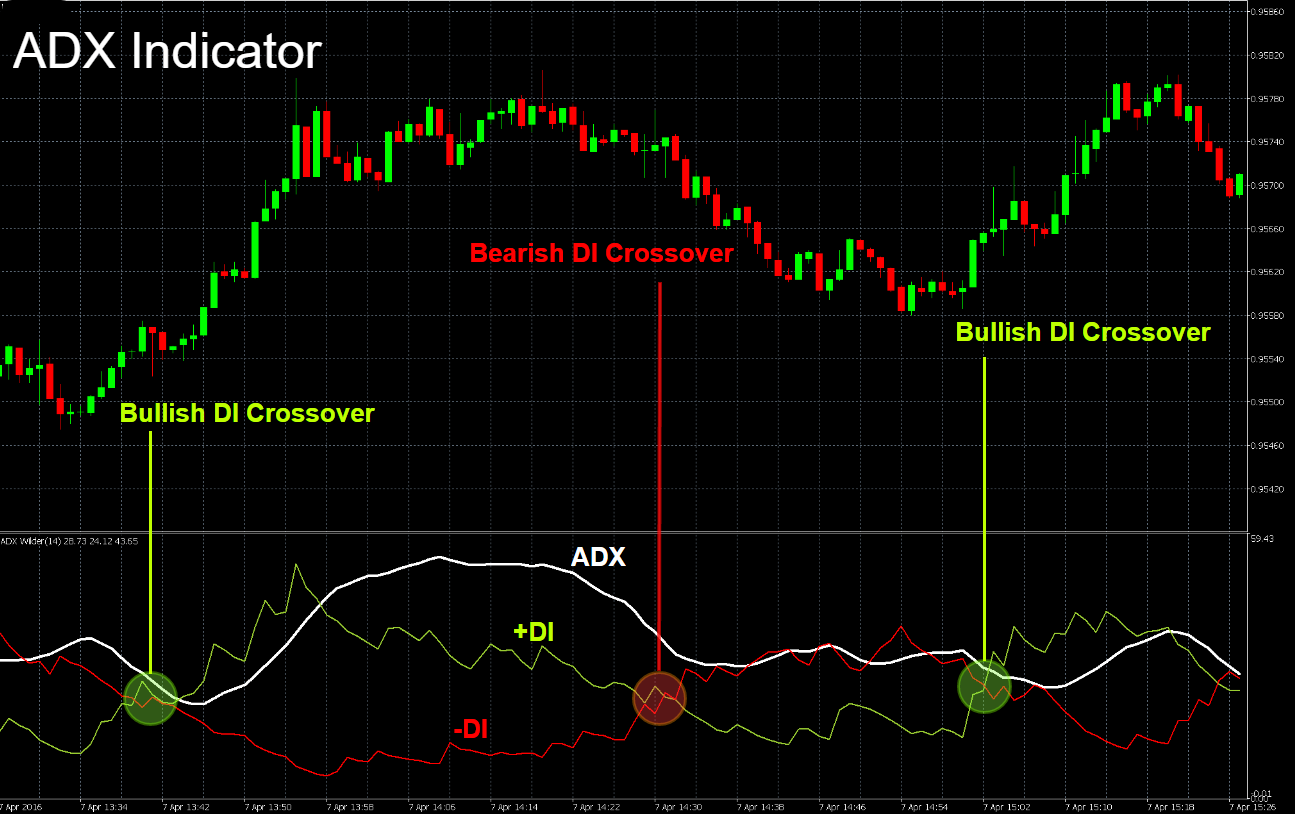
The ADX can help traders determine the direction of a trend and identify potential trend crossovers by using the DMI, which is made up of the +DMI and -DMI lines. A bullish crossover occurs when the +DMI line crosses above the -DMI line, indicating a potential uptrend, while a bearish crossover occurs when the -DMI line crosses above the +DMI line, indicating a potential downtrend. Traders should use the ADX in conjunction with other indicators and analysis techniques to confirm their trading decisions and manage risk.
ADX Price Divergence
ADX price divergence occurs when the price of an asset is moving in one direction, while the ADX is moving in the opposite direction. This can be a warning sign that the current trend may be losing momentum and could reverse soon.
Traders should use price divergence signals in combination with other indicators and analysis techniques to make informed trading decisions and manage risk appropriately.
Price and the ADX
Analysts and investors rarely rely solely on the average directional index indicator (ADX). It is frequently used in conjunction with trend indicators, such as moving averages or support and resistance zones, which are used to analyze price movement because it does not indicate trend direction.
For example, an ideal application of using trend indicators in combination with the ADX would be an instance where the price of a security has traded within a range, with clearly defined support and resistance price levels, but then breaks out of that trading range by trading through a support or resistance level.
If the price breakout is accompanied by rising ADX readings that indicate the presence of a trend, then that would constitute a confirming indication of the validity of the breakout, and an analyst would project a trend continuing in the direction of the breakout.
Conclusion
The ADX is a powerful tool that can help traders determine the strength of a trend and make informed trading decisions. It can be used in a variety of trading strategies, including trend following, trend reversals, ADX breakouts, and ADX divergence.
Traders can use other technical indicators, such as Moving Averages and support and resistance levels, to confirm the direction of the trend and set stop losses accordingly. The ADX can be a valuable addition to any trader’s technical analysis toolkit.


