

The Accumulation/Distribution Indicator (A/D) is a technical analysis tool that is used to measure the buying and selling pressure of a stock. The indicator uses a combination of price and volume data to determine whether a stock is being accumulated or distributed by traders.
The A/D indicator is a running total of the difference between the number of shares that are being bought and sold. When the indicator is positive, it means that more shares are being bought than sold, indicating that the stock is being accumulated.
Conversely, when the indicator is negative, it means that more shares are being sold than bought, indicating that the stock is being distributed.
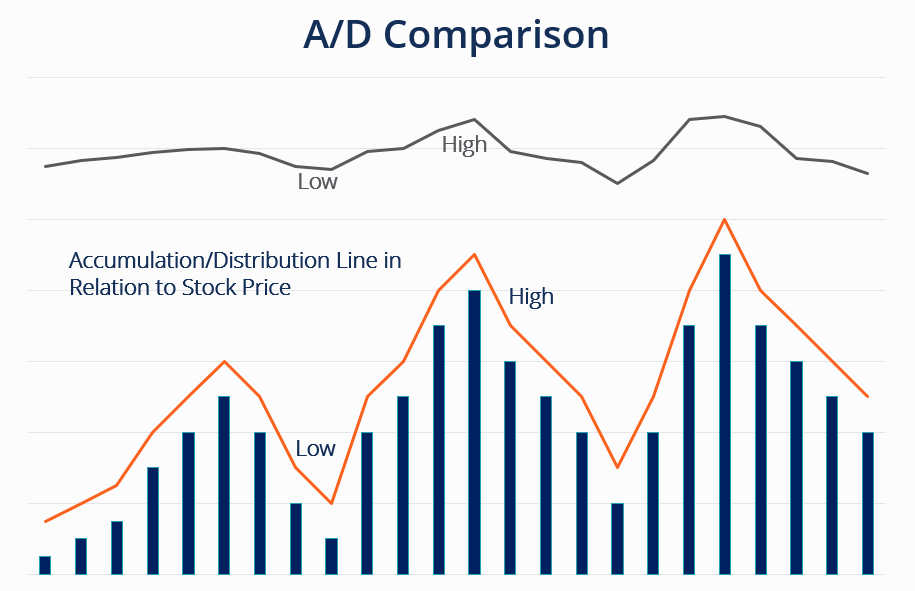
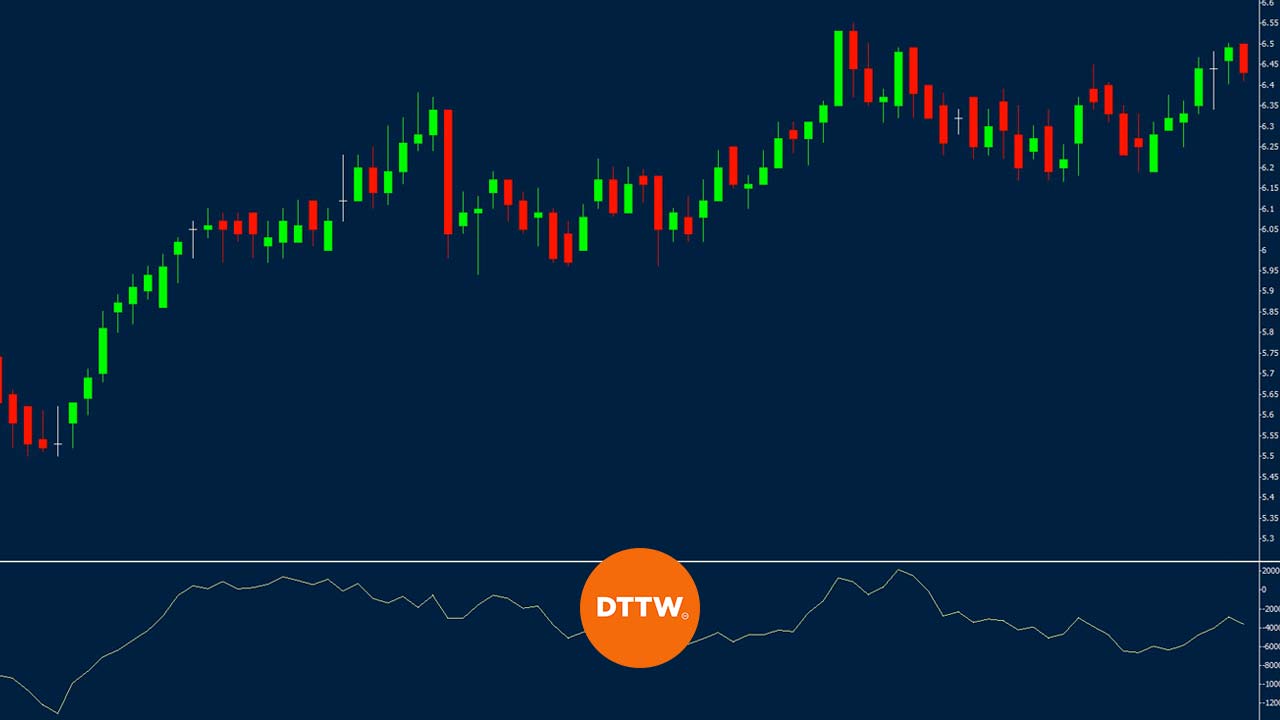
An Accumulation/Distribution (A/D) chart is a type of chart used in technical analysis to measure the buying and selling pressure of a stock.
The chart is created by plotting a cumulative total of the difference between the number of shares that are being bought and sold over a specified period of time.
When the line on the A/D chart is trending upward, it indicates that there is more buying pressure than selling pressure and the stock is being accumulated.
Conversely, when the line is trending downward, it indicates that there is more selling pressure than buying pressure and the stock is being distributed.
Accumulation/Distribution Formula
There are 3 parts to the distribution formula for accumulation:
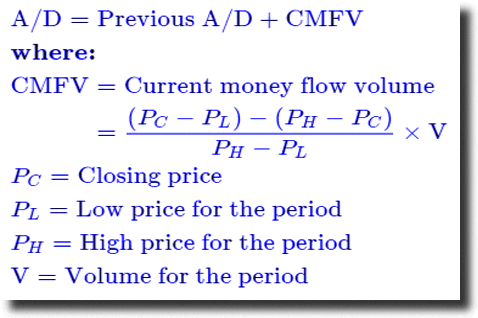
The Accumulation/Distribution (A/D) formula is used to calculate the buying and selling pressure of a stock. The formula is calculated using the following steps:
- First, calculate the money flow multiplier by dividing the stock’s current closing price by the previous day’s closing price.
- Next, calculate the money flow volume by multiplying the money flow multiplier by the stock’s trading volume for the current day.
- Finally, calculate the A/D line by adding the money flow volume for each day and cumulatively summing the values.
The formula can be represented as:
Money Flow Multiplier = (Close Price / Previous Close Price)
Money Flow Volume = Money Flow Multiplier x Volume
A/D Line = A/D Line (previous day) + Money Flow Volume
When and why to Use an Accumulation/Distribution (A/D) Indicator?
Traders typically use the A/D indicator in conjunction with other technical analysis tools such as trendlines, moving averages, and support and resistance levels. It can be used in both short-term and long-term trading strategies and can be applied to any market including stocks, forex, or commodities.
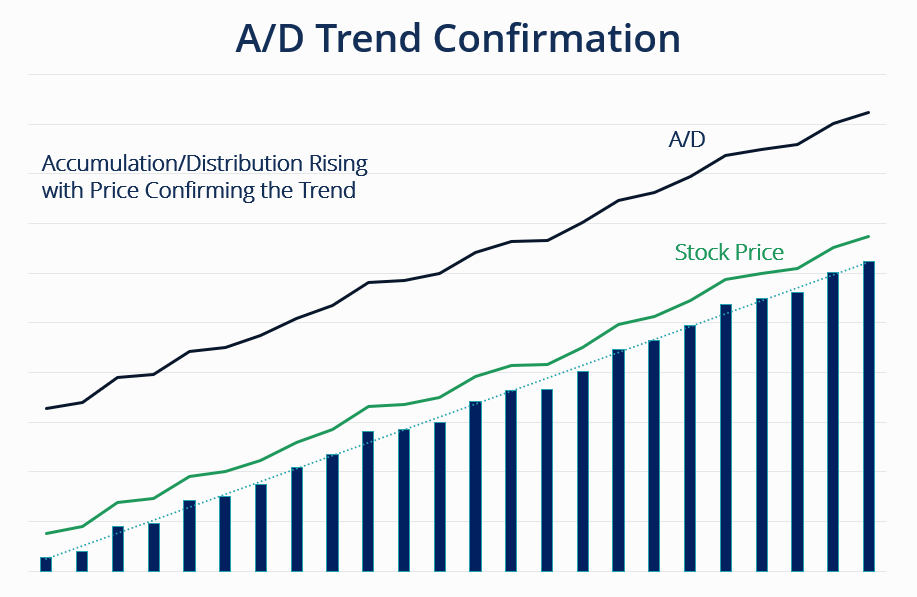
Trend Confirmation
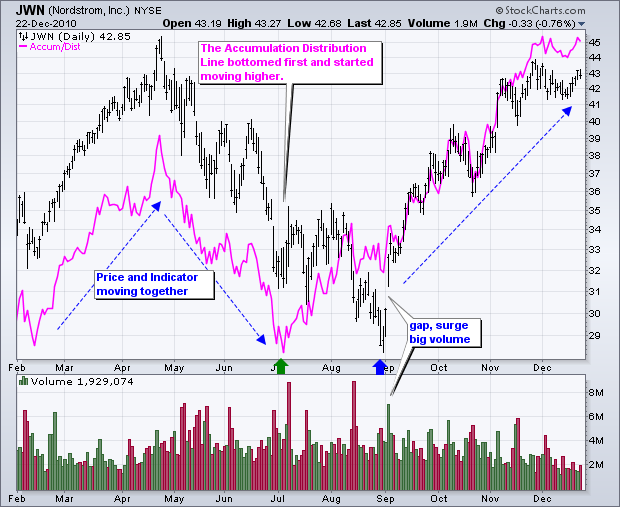
Trend confirmation in the Accumulation/Distribution (A/D) indicator is a technique used to confirm the direction of a stock’s trend using the A/D indicator.
The A/D indicator is a momentum indicator that uses volume data to measure buying and selling pressure in a stock. By comparing the direction of the A/D indicator to the stock’s price trend, traders can confirm whether the stock is in an uptrend or a downtrend.
If the accumulation distribution line is moving in the same direction as the stock’s price trend, it is considered to be confirming the trend.
On the other hand, if accumulation distribution line is moving in the opposite direction, it is considered to be a non-confirmation, which may indicate a potential trend reversal.
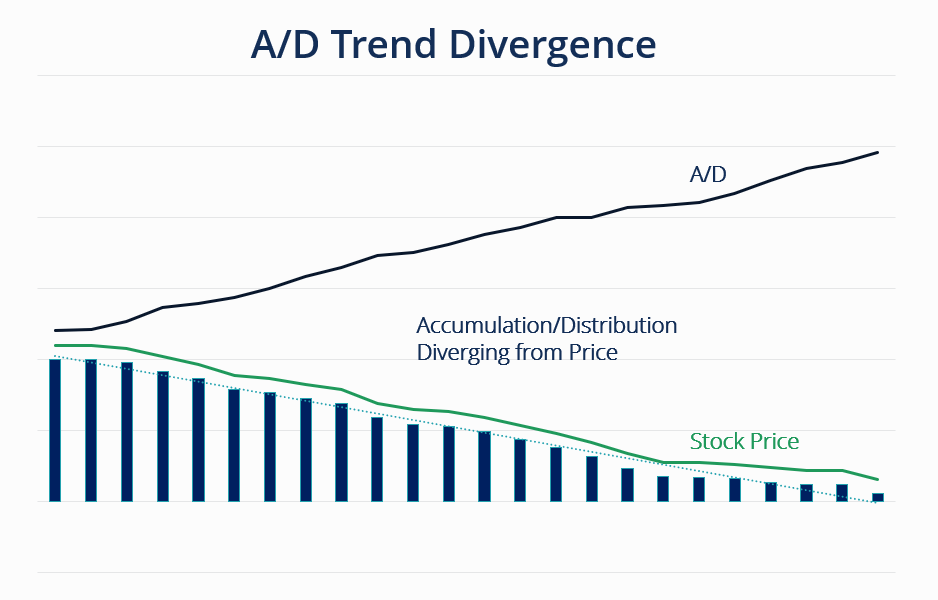
Divergences
Divergences in the accumulation distribution line can be used to identify potential changes in the direction of a stock’s price.
A bullish divergence occurs when the stock’s price is making new lows, but the A/D line is making new highs. This can indicate that buying pressure is increasing and the stock may be due for a price reversal.
On the other hand, a bearish divergence occurs when the stock’s price is making new highs, but the A/D line is making new lows, indicating that selling pressure is increasing and the stock may be due for a price reversal.
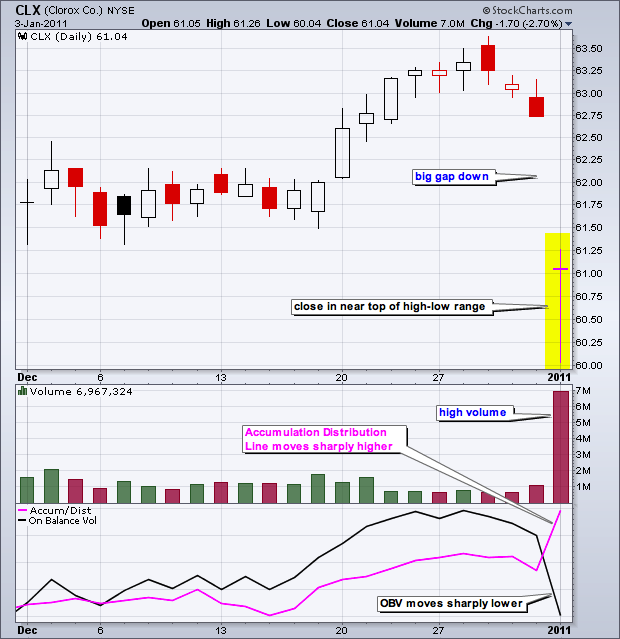
On-Balance Volume vs. Accumulation/Distribution Indicator
On-Balance Volume (OBV) is a technical indicator that uses volume information to indicate buying and selling pressure. It is calculated by adding the volume on days where the stock closes higher, and subtracting the volume on days where the stock closes lower.
The accumulation/distribution indicator (A/D) is a momentum indicator that uses both price and volume to indicate buying and selling pressure. It is calculated by multiplying the close price by the volume, and then cumulatively summing the resulting values.
Both OBV and A/D can be used to identify potential trend changes, but they are based on different calculations and may produce different results.
Pros of the A/D indicator include:
- It can provide insight into the overall market trend and whether the trend is bullish or bearish
- It can indicate whether the market is overbought or oversold
- Accumulation distribution line can be used in conjunction with other indicators for confirmation of market trends
Cons of the A/D indicator include:
- It does not take into account the magnitude of the price change, only the direction
- It may not accurately reflect the overall market trend if the number of advancing stocks is skewed by a few large companies
- It may not be useful in markets with low trading volume, where the number of advancing and declining stocks may be artificially skewed.
ADL vs. OBV
The Accumulation Distribution Line (ADL) and On Balance Volume (OBV) are both technical analysis indicators that are used to measure the buying and selling pressure in a market or specific security.
Both indicators are used to measure the net buying and selling pressure in the market, but they use different methods to calculate this. OBV is a simple indicator that only uses volume data, while ADL uses both volume and price data.
Both indicators can be used together to confirm the market trends.
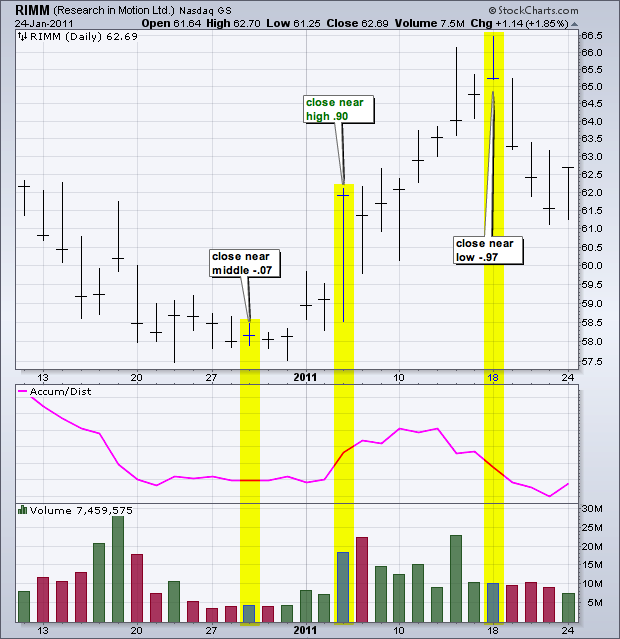
Accumulation Distribution Indicator: How to Read It
The Accumulation Distribution Indicator (ADI) is a technical analysis tool that uses both price and volume data to measure buying and selling pressure in a market or specific security. It is used to identify whether there is net buying or selling pressure in the market, and can help identify trends and potential market turning points.
To read the ADI, you will first need to calculate it using the following formula:
ADI = ADI(previous) + [(Close – Low) – (High – Close)] * Volume
The ADI is plotted as a line on a chart, and it can be used in the following ways:
- Bullish trend: If the ADI is rising, it indicates that there is more buying pressure than selling pressure in the market, which is a bullish sign.
- Bearish trend: If the ADI is falling, it indicates that there is more selling pressure than buying pressure in the market, which is a bearish sign.
Conclusion
One of the benefits of the A/D indicator is that it can give an indication of the market trend and direction, whether it is bullish or bearish. Additionally, it can be used in conjunction with other indicators for confirmation of market trends.
However, it’s important to keep in mind that the A/D indicator has also some limitations, as it does not take into account the magnitude of the price change, only the direction.
It may not accurately reflect the overall market trend if the number of advancing stocks is skewed by a few large companies, and it may not be useful in markets with low trading volume.
Like any other technical indicator, the A/D should not be used in isolation, but rather in conjunction with other indicators and analysis to make more informed investment decisions.


