

Technical analysis is one of the two techniques for analyzing when it comes to financial markets.
The other one is fundamental analysis, which involves observing the economic, political, and macro events to analyze their influences on currencies, stocks, and other securities.
Technical analysis on the other hand involves the use of technical indicators such as moving averages, relative strength index, and other momentum indicators to predict the asset price future movements.
In this blog post, we will discuss the on-balance volume indicator, which is developed by Joseph Granville in 1963.
What is the On-Balance Volume Indicator (OBV)?
On balance volume (OBV) is a measurement of buying and selling pressure as a cumulative indicator, adding volume on balance on up days while subtracting it on down days.
Here, when the security closes higher than the previous day’s closing price, all of the volumes of the day are considered up-volume.
However, if the security closes lower than the previous day’s closing price, all of the volumes for the day are considered down-volume.
On balance volume indicator is a great way for you as a trader to predict price movements.
Traders can use it in day trading strategies to confirm price trends and gain the most profit.
How does the OBV work?
Instead of focusing on the actual value of the on-balance indicator, which is unimportant, we should focus on the direction of the OBV line.
Please consider the below points.
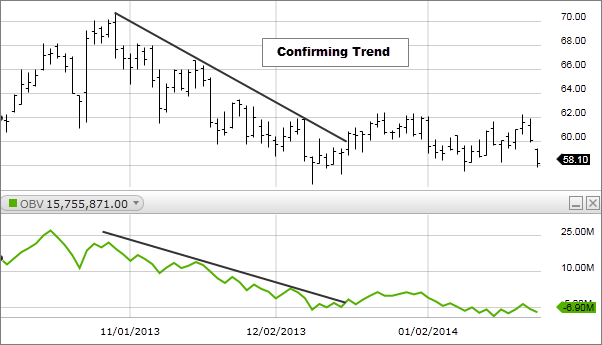
- When both the asset price and balance volume OBV are making higher tops and higher bottoms, the upward trend is likely to continue.
- When both the asset price and balance volume OBV are making lower tops and lower bottoms, the downward trend is likely to continue.
- If the on-balance volume is increasing during a trading range, accumulation may be taking place, which indicates an upward breakout.
- If the on-balance volume is decreasing during a trading range, distribution may be taking place, which indicates a downward breakout.
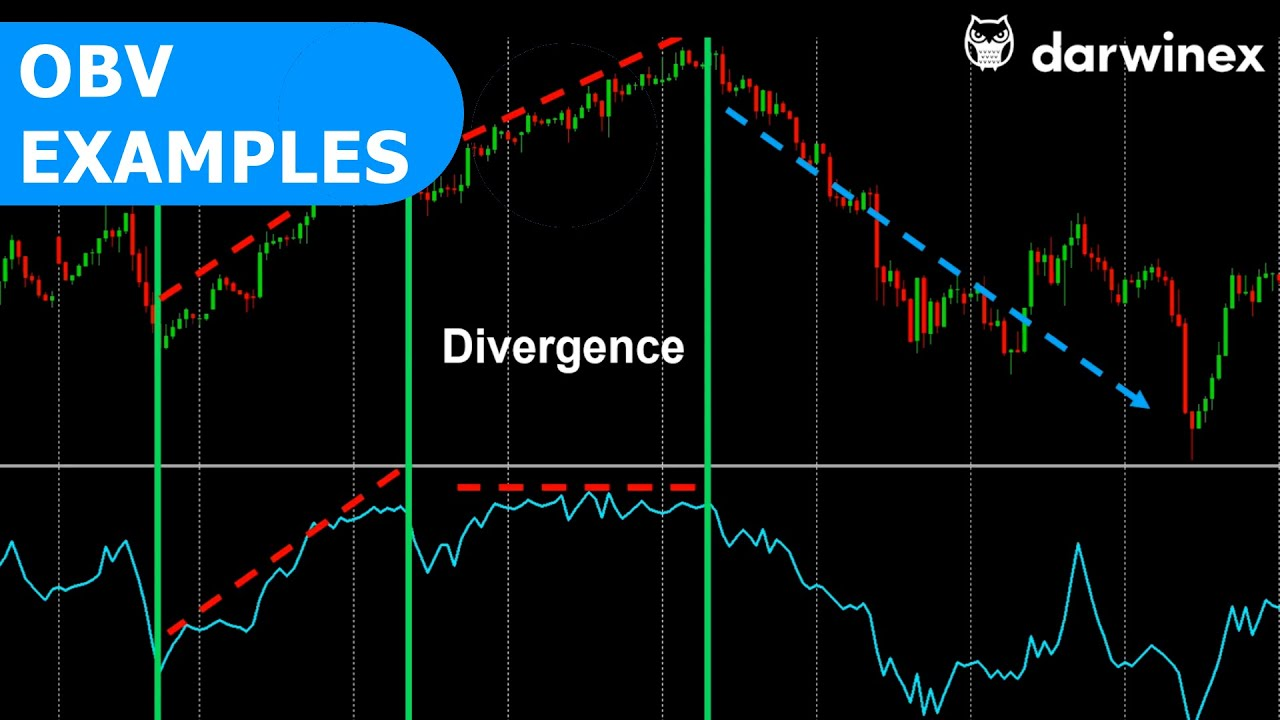
- If the price continuously makes higher tops and the on-balance volume indicator fails to make higher tops, the upward trend will likely fail, known as a negative divergence.
- If the stock’s price continuously makes lower bottoms but the on-balance volume indicator fails to make higher bottoms, the downward trend will likely fail, known as a positive divergence.
Calculating the balance volume indicator
On balance, volume is calculated by adding the day’s volume to a cumulative total value, when the price of the security closes up than the previous day’s closing price, and subtracting the day’s volume when it closes down.
Consider this formula, based on this information.
- If today’s close is greater than yesterday’s close then: OBV = Yesterday’s OBV + Today’s Volume.
-
If today’s close is less than yesterday’s close then: OBV = Yesterday’s OBV – Today’s Volume.
-
If today’s close is equal to yesterday’s close then: OBV = Yesterday’s OBV.
On-Balance Volume Trading Strategies
Because the OBV is a cumulative indicator, its absolute values are not important. Instead, traders should define on-balance volume indicator trends and support resistance levels.
The OBV trend direction and support resistance levels are key factors in looking for trading signals with on-balance volume.
As a trader, you need to know that on balance volume indicator works well in trending markets. You should avoid using it when the markets are consolidating.
For making better trading decisions, you can combine OBV with other indicators. These include moving averages and momentum oscillators such as a relative strength index. The combined indicators can act as a filter by cutting out false signals generated by OBV.
Follow and confirm trends
A buy signal is generated when the on-balance volume is rising and the security price rises or consolidates.
A sell signal is generated when the on-balance volume is falling and the security price falls or consolidates.
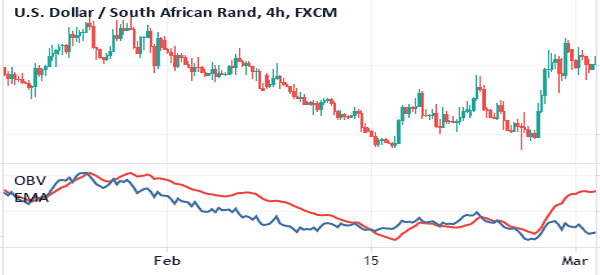
An example of using the on-balance volume trend is following the signal we can see in the chart below.
We observed that the price movement of the EUR/USD pair increased when the on-balance volume indicator was on an uptrend.
The sell signal example, generated by the trend following approach, of on-balance volume. The future price movements started to decline when the OBV indicator declines.
Divergences
Another way to use this momentum indicator is to find when a currency pair or stock price and on-balance volume readings diverge.
An uptrend can be reversed if OBV is falling, this is a negative or bearish divergence. It is a good opportunity for going short.
The positive or bullish divergence happens when the security price is falling but OBV readings are rising. It is a good point for taking a long position.
OBV vs accumulation/distribution
OBV and accumulation/distribution are quite similar, having a close resemblance to each other, which we can see from the below chart. However, there is a different approach to calculating indicator values.
OBV adds a period’s total volume if the security closes at a higher price than the previous close and subtracts if it closes at a lower price. The OBV line forms a sum of negative and positive volumes.
Instead, accumulation/distribution indicator calculation of money flow based on period high, low, and close prices. The A/D line is a sum of money flows for a given number of periods.
Limitations of OBV Indicator
The OBV Indicator is a great technical indicator for stocks and other securities. It is very useful when determining trends. However, you can’t solely rely on it as there are several limitations to using the OBV indicator.
The OBV is a leading indicator as other volume-based indicators and relies on the idea that trading volume and an asset price are correlated with each other.
This means that changes in the volume are causing changes in price but it is not always correct and OBV can generate many false signals.
Also, a large spike in volume on a single day can throw off the indicator for a while.
The OBV indicator should be used with other technical lagging indicators to confirm generated trading signals. In this case, a trader can make better trading decisions and avoid negative trades.
Conclusion
The OBV is an essential technical indicator in the market for producing trading opportunities. If you use it well, it can be a key to the stock market, which can help us identify where to buy or sell an asset to make the most stock market profits.


