


Trading success starts with mastering the specific types of gaps that dictate market volatility. A gap chart visually represents these massive moves, but true profit comes from understanding the gap theory in stock market analysis—not just spotting a simple stock gap. These sharp discontinuities, often called a price gap, are essential indicators of shifting market sentiment. Many traders fail because they treat every upward or downward void the same. You need specialized knowledge to discover the high-probability setups hidden within this price action. Can you truly transform your trading results without understanding the proven execution techniques for each of the four types of gaps in trading? Read on to unlock the powerful strategies professional traders use to turn these volatile market voids into consistent, high gains.
What is a Gap?
A gap represents an area on the chart where no trading takes place. This occurs as a stock’s price sharply moves up or down with nothing in between, indicating that the market opened at a different price than its previous closing price.
Its formation is mainly due to any news in that specific stock, after the trading session.
For instance, if the company’s earning is higher than anticipated, then the stock will gap up the following day.
Why a Gap Occurs and What it Tells You?
Gaps typically happen when an event or piece of news causes a flood of sellers or buyers into the security. This leads to the price opening being considerably lower or higher than the prior day’s closing price. Based on the type of gap, it can signal either a new trend’s beginning or a previous trend’s reversal.
Fundamental factors are the most common reason. For instance, in the graph above, ASOS shares increased overnight as investors bet that the company would be able to address serious operational problems after its full-year results revealed it avoided another profit warning.
Besides, a gap happens when there’s low liquidity in financial markets. The number of buyers or sellers is less to trade that asset.
It may also result in case of a high volume in that stock.
Important news such as product launches, analyst promotions and demotions, earning releases, and new senior positions can lead to price gaps. This is due to their ability to affect the market drastically in either direction between trading sessions.
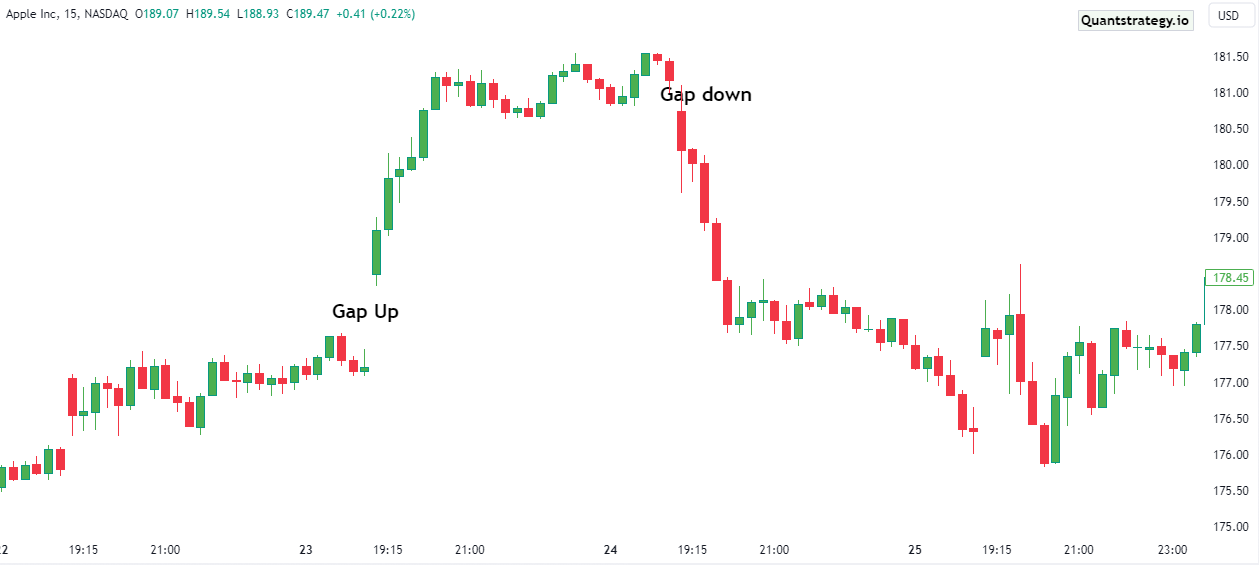
Gap Down and Gap Up Stocks
The price movement on either side of the gap is referred to as “gap up” or “gap down” stocks. A full gap up, as demonstrated above, occurs when the opening price is higher than the prior high price, and a full gap down happens when the opening price is lower than the previous low price.
Four Types of Price Gaps
Besides gap up and gap down, depending on where they appear on a chart, a price gap has four main types. These are as follows:
- Common Gaps
Also known as trading gap or area gap, a common gap generally forms in nervous markets and usually closes in a few days. It can result from a stock becoming ex-dividend in case of low trading volume.
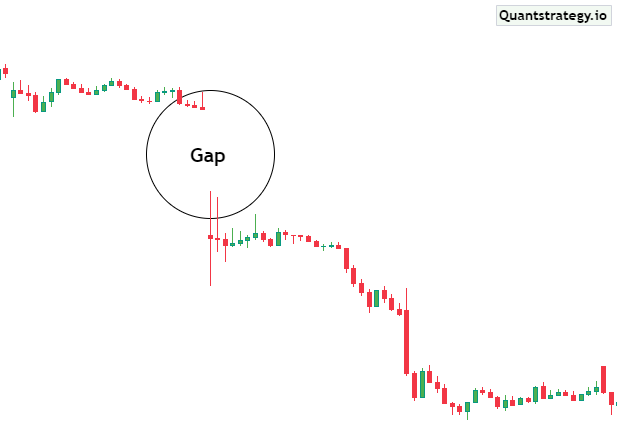
Common gaps appear in a trading range and reinforce the moment’s seeming lack of interest in the stock. These types of gaps aren’t big in size and get filled comparatively quickly. The picture below demonstrates the price chart for AAPL. A common gap frequently occurs within the range but without any signaling effect.
Hence, keeping knowledge about this type of price gap is good, however, it is generally doubtful that it will produce exciting trading opportunities.
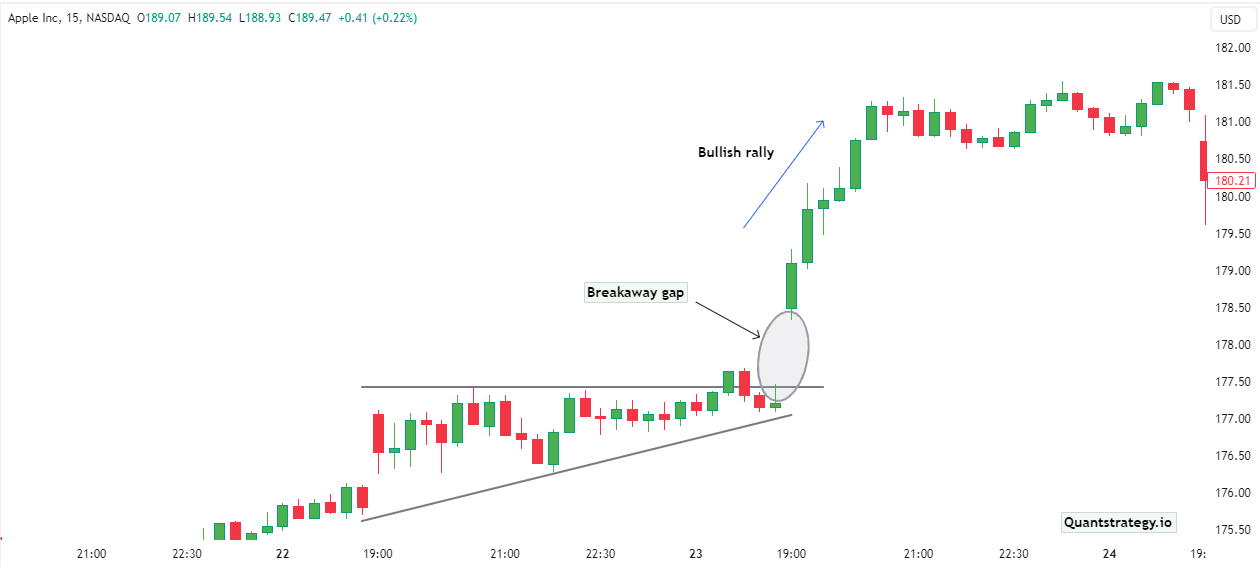
- Breakaway Gaps
The breakaway gap generally doesn’t get filled initially. It occurs when the stock price gaps over the support or resistance level. It’s similar to a breakout pattern, however, the actual break here occurs in the form of a gap.
Such type of gap indicates a strong momentum, and the price stays trending following it.
Moreover, the larger the breakaway gaps are, the stronger the following candles are after the gap and the stronger will be the prevailing trends.
- Continuation Gaps
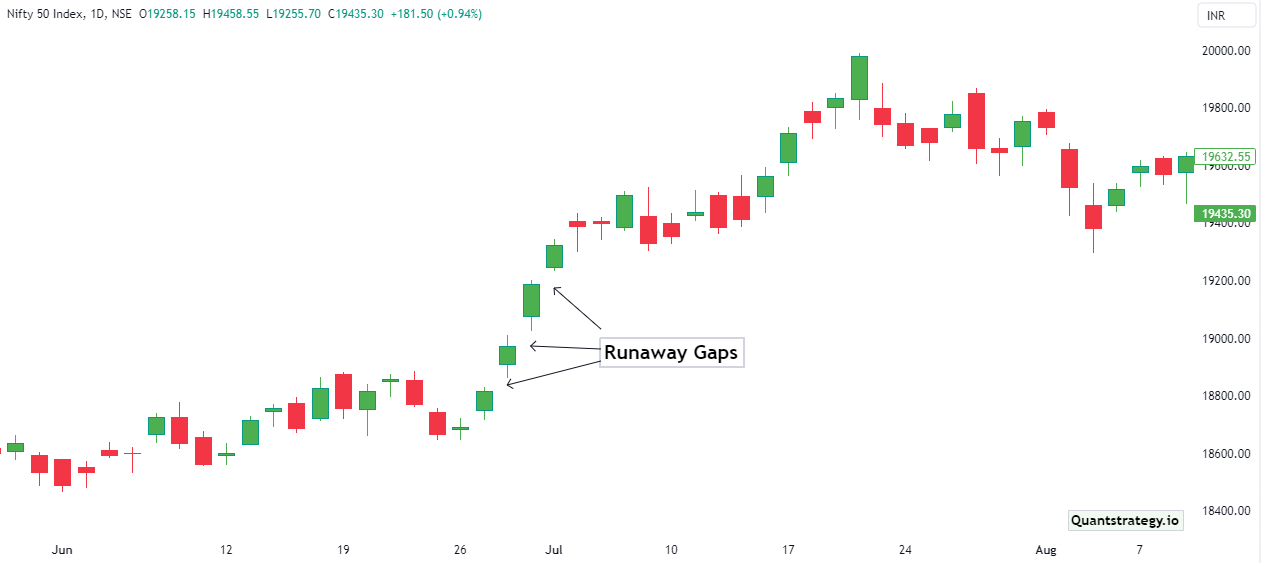
Continuation gaps are also known as runaway gaps or measuring gaps. They occur in the middle of the trends.
In an uptrend, they represent traders or investors who didn’t get in during the start of the uptrend, and while waiting for price retracement, they decided that it wasn’t going to happen.
There’s a boosted buying interest instantaneously. This type of continuation gap depicts an almost panic state among traders.
Continuation gaps occur from important news events as well as they may lead to new interest in the asset.
In a downtrend, a continuation gap refers to an increment in the stock’s liquidation by the buyers standing on the sidelines.
The daily chart of Nifty shows an example of the continuation gap below.
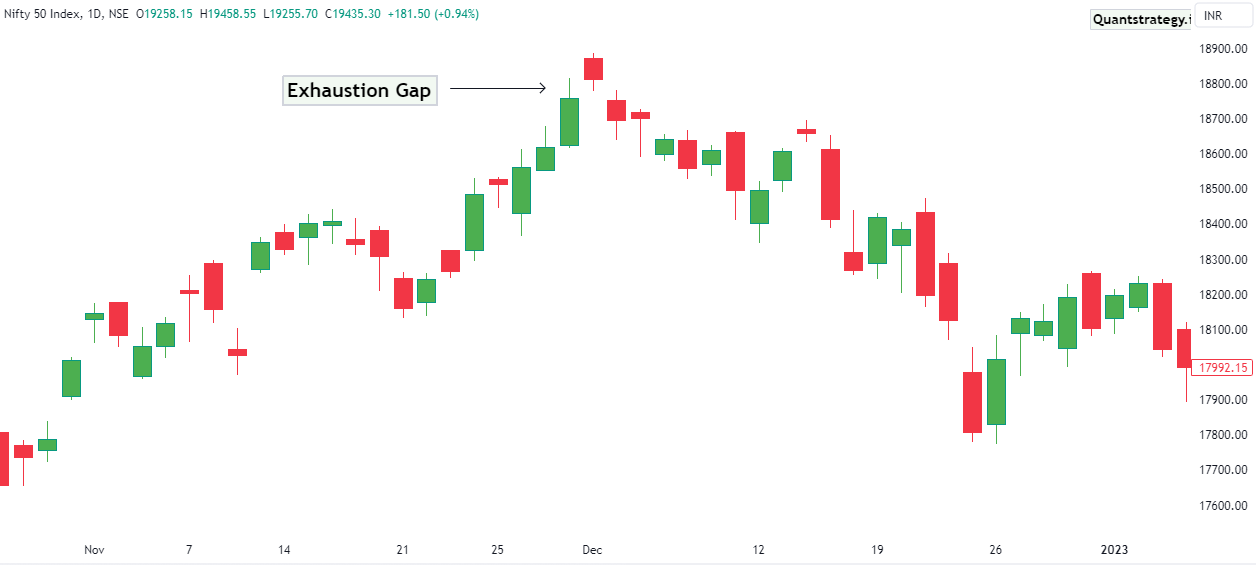
- Exhaustion Gaps
An exhaustion gap usually gets filled and the ideal method to trade it is not to speculate but rather to use the knowledge to time exits and entries around the pattern.
Exhaustion gaps typically happen at the end of a price trend or a crucial support and resistance level. This is frequently brought on by traders adopting a herd mentality and jumping on the trend, pushing the stock into overbought territory. Experienced traders will therefore be on the lookout for a reversal and adopt the opposite position from the prior trend.
The first gap in the trend’s direction can resemble a runaway gap, but the candle that follows is typically after a Doji pattern indicating rejection of a price level or indecision.
Furthermore, to avoid encountering false signals, its recommended to hold back for the completion of the candle that verifies the change in direction.
How to Find Gaps?
One of the simplest strategies to find price gaps is to look for pre-market movers. Most of the time, the businesses on this list open with a significant gap.
For example, Snap was one of the pre-market movers at the end of July. As shown in the picture below, the stock market created a significant down gap after the company produced weak results.
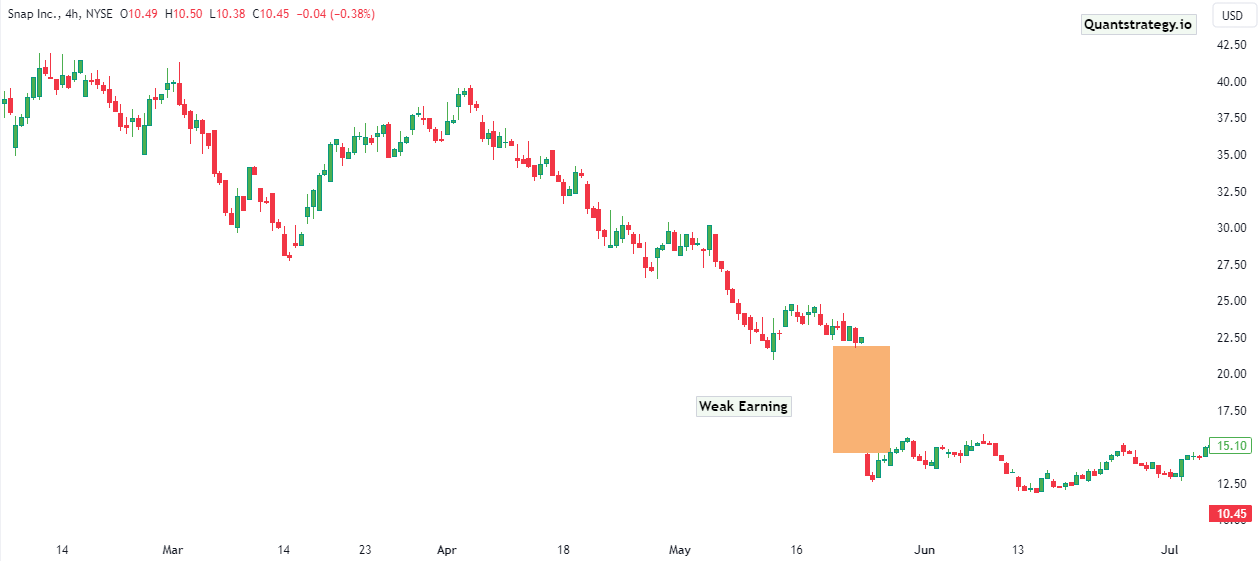
Finding companies that are creating news before the market opens is another technique to identify market gaps. Signing up for a free watch list can be useful for identifying these stocks.
What happens after a Price Gap develops?
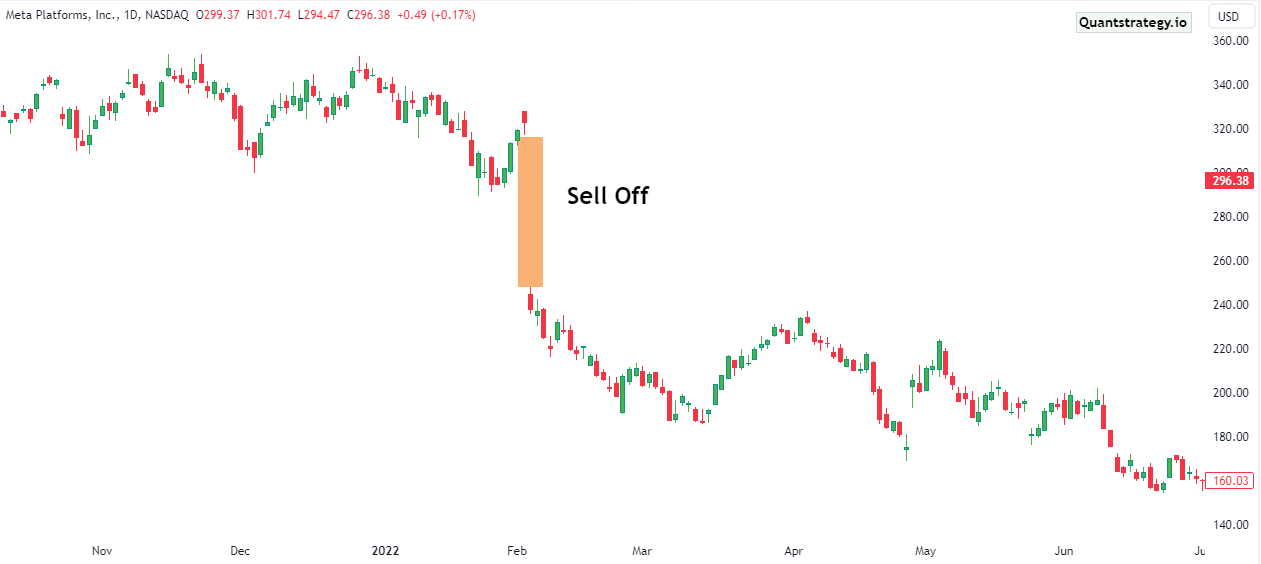
One of the three things can occur following the formation of a gap in the stock market.
First, the price of an asset can keep moving in the gap’s direction. For instance, the price of an asset may continue along that trend when a bullish gap arises, such as the stock of the Meta platform kept declining after its bearish gap, as shown in the chart below.
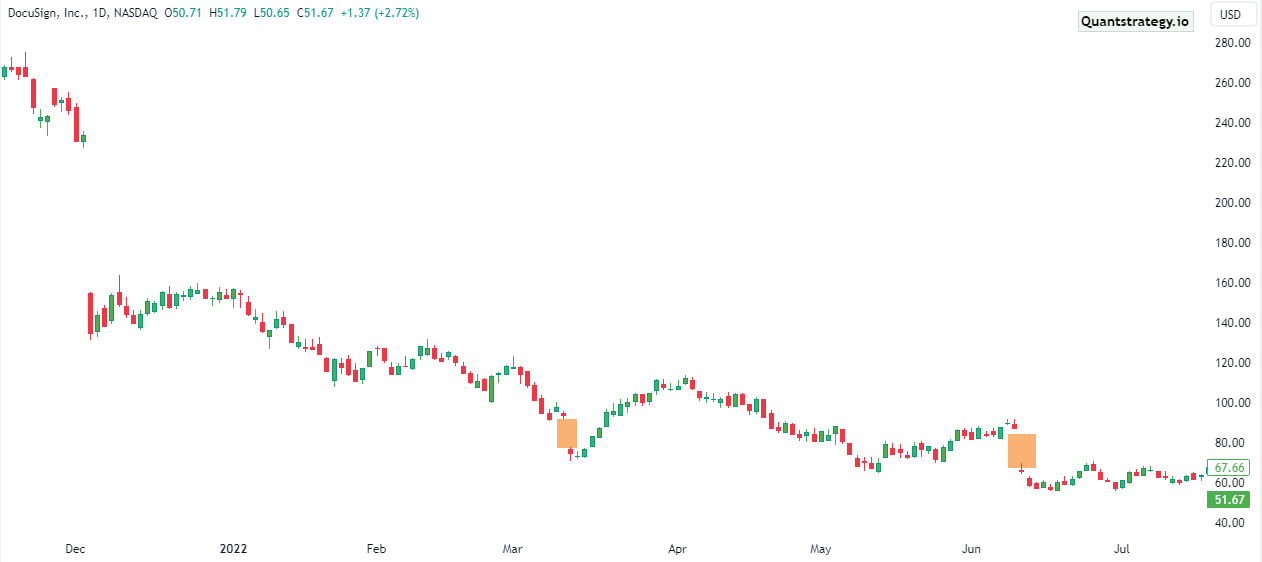
Second, a price gap may get filled within a matter of a few days or months. For instance, DocuSign’s stock created a bearish gap in the chart below that was then shortly filled.
Lastly, when traders pay attention to the upcoming significant moves, a gap may be followed by a protracted period of consolidation. It is always better to note the asset’s volume in all these.
Trading the Price Gaps: Strategies & Tips
You can experiment with a variety of gap trading strategies, from fading and predicting gaps to employing indicators to assist you in understanding the price action.
Fading the Gap
‘Fading the gap’ refers to filling gaps within the same trading day they arise. Suppose a stock’s price rose sharply at the opening with a higher price than the previous day’s close following a strong earnings report. Let’s imagine that as the day goes on, traders look more closely at the company’s presentation deck, notice certain issues, and decide to sell. Eventually, the price hits yesterday’s close, and the gap’s filled.
Since the volume that produces the gap is frequently a result of FOMO in trading, irrational exuberance from less experienced traders can be especially helpful for more seasoned market practitioners when it comes to fading the gap.
Predicting a Gap
It might be appropriate to enter a position if fundamental or technical indicators suggest that there could be a gap on the following trading day. For instance, thorough familiarity with a certain business and its operations can assist a trader in anticipating stock gaps before an earnings report.
Using Tools/Indicators
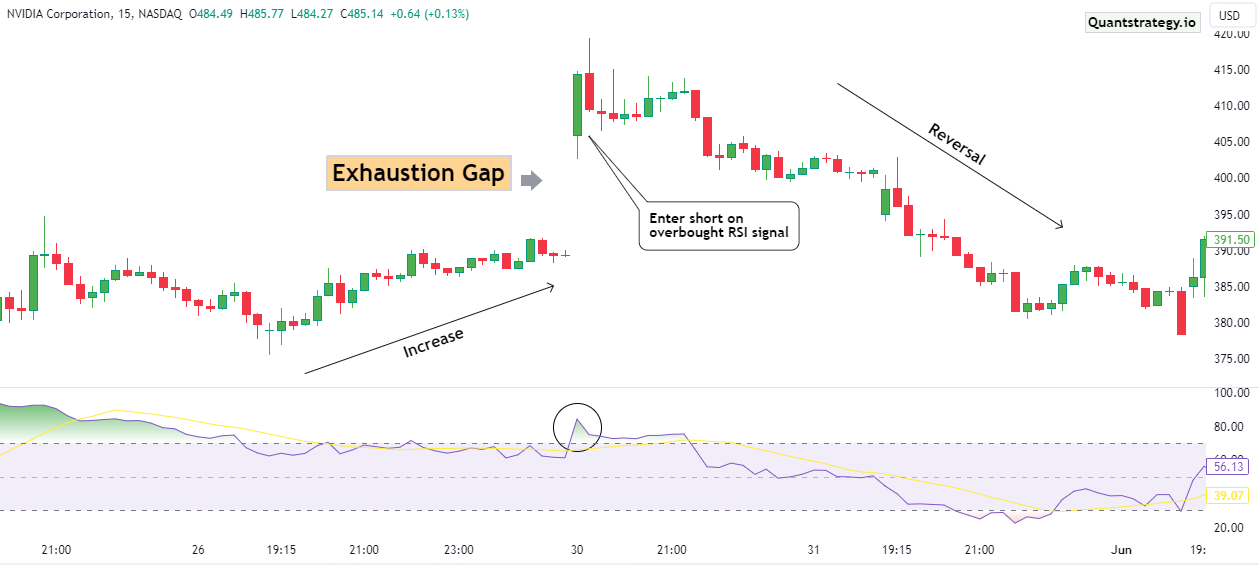
Traders can deploy indicators or tools like the RSI and Exponential Moving Average to determine key price points and make informed decisions. For instance, the price chart below demonstrates how an overbought RSI indicator can be employed to enter short following an exhaustion gap.
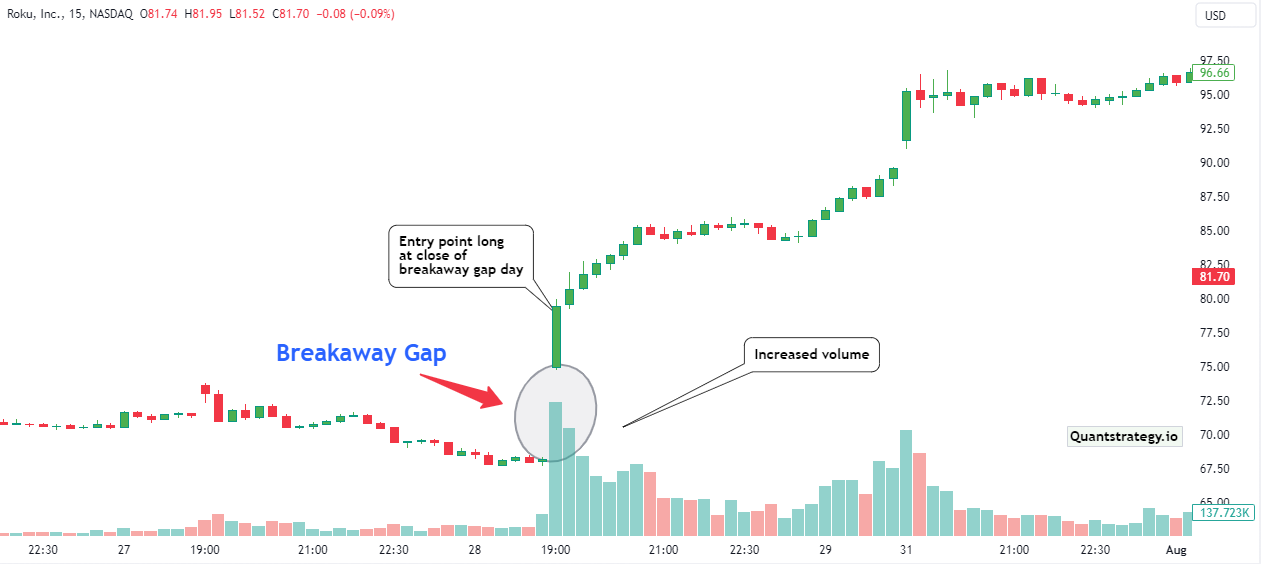
The following graph illustrates a strong response to the breakaway gap example. It shows where a long position is taken in response to the spike in trading volume after a gap, as well as a potential initial stop loss level to guard against the increased risk. Entering on a pullback, which allows testing the gap, would be a more cautious strategy for this breakaway gap.
With this strategy, traders may get away with a much tighter initial stop-loss order even though the upside potential may be smaller.
A few key things to consider while trading gaps are:
- Because there is frequently no immediate support or resistance, a stock will rarely cease filling the gap once it begins.
- Be sure to classify the gap you intend to play accurately. Exhaustion gaps and continuation gaps indicate price movement in two separate directions.
- Institutional investors and algorithmic trading systems may participate in irrational exuberance among retail investors to benefit their portfolios, therefore, use caution when using this indication and hold off on taking a position until the price begins to break.
- Keep an eye on the trading volume. In breakaway gaps, the high volume should be present, while in exhaustion gaps, the low volume should be present.
Limitations of Gaps
Despite being simple to identify, gaps have some limitations. One’s ability to recognize the various types of gaps that exist is the obvious defect. If a gap is understood incorrectly, it could be a disastrous error that prevents one from taking advantage of a buying or selling opportunity. This can have a significant impact on one’s gains and losses.
Conclusion
Stock gaps occur when the price of a stock suddenly jumps between two candlesticks, producing a vertical gap in a chart. These gaps can also be the consequence of a sudden rise in trading activity in the middle of a bigger trend; however, they often happen in response to after-hours news. Gaps frequently fill; however, they do not have to. It’s crucial for traders to recognize the gap type they are trading accurately and to hold off on placing a trade until a directional movement has formed.


