


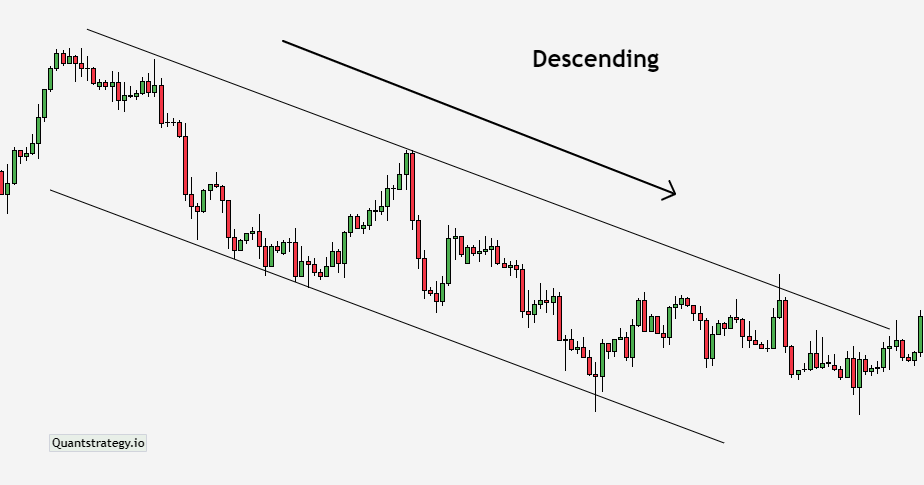
When the lower lows and lower highs are connected in a downward trend, they create a descending channel pattern with parallel trendlines.
The gap between these trendlines represents the descending channel that is usually covered under the umbrella of trend channels.
Understanding the Descending Channels
Practically, technical channels are the key elements to identify and track the trends prevailing in the financial market.
A descending channel pattern is in use for the same purpose where it charts the trendlines along the resistance and support levels of a security.
In other words, this channel helps to identify the optimal support and resistance levels to let traders decide whether to buy the security or sell it.
As soon as the price fluctuates within the trendline boundaries and there is anticipation to experience the descending channels, traders may initiate a trade.
The descending trendlines can be used to create a traverse path for security, followed by holding the current trend.
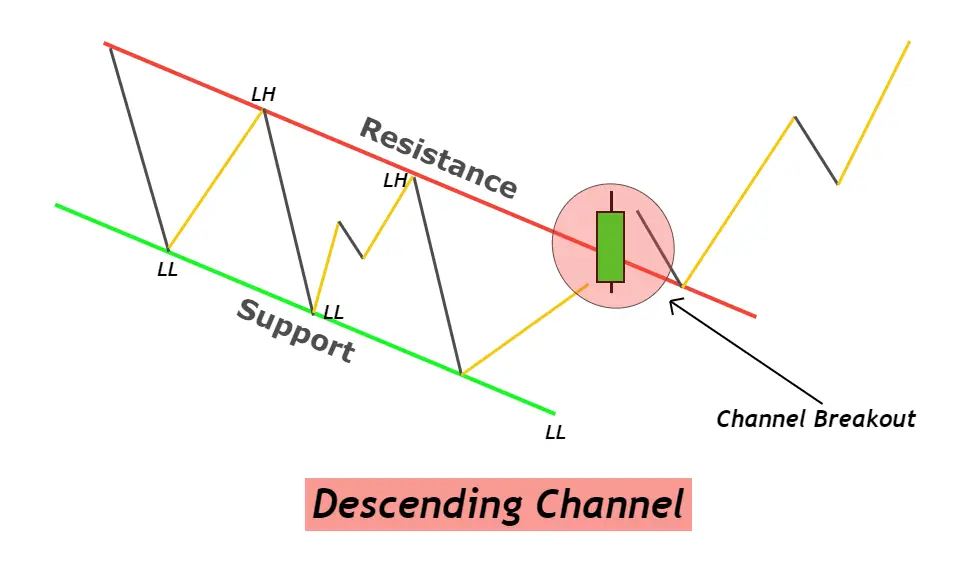
Breakout is another potent signal that happens when the price of a security deviates from the established boundaries of the channel and moves either upward or downward.
As soon as the phenomenon occurs, it makes the price follow that breakout.
If the movement is similar to the existing trend, it channel is referred to as a continuation chart pattern whereas, if it’s opposite, the descending channel will be called a reversal.
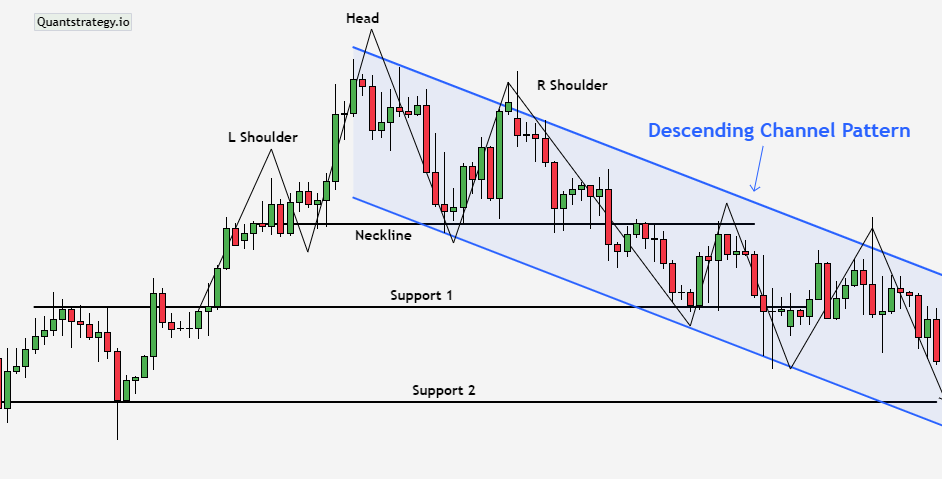
Identification and Use of the Descending Channel Pattern
The descending channel pattern is famous for its unique appearance that makes it easy for traders to identify it on the price chart.
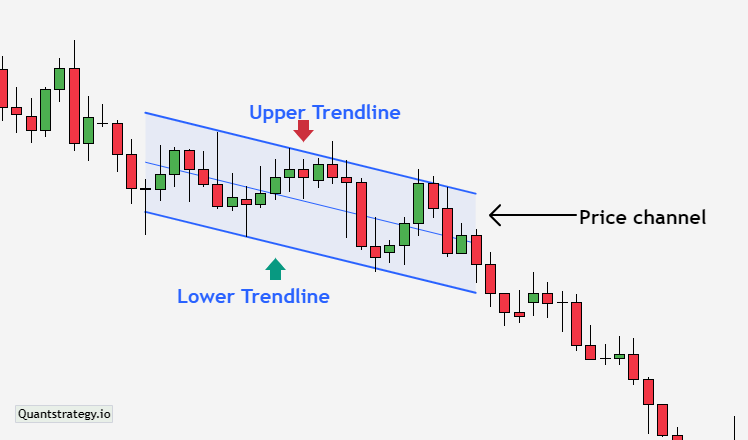
Its discernable structure comprises 3 parts: a lower channel line, a price channel, and an upper channel line.
Let’s get into details about all the three elements:
-
Upper Channel Line: It is responsible for connecting price action’s upper bounds. In other words, the upper channel line is referred to as the upper trend line that demonstrates the higher point of a periodic trading range. However, it slopes downward to indicate incremental price drops through a series of lower highs.
-
Lower Channel Line: As the name suggests, the lower channel line is responsible for working on price action’s lower bounds. It shows the bottom of the periodic trading range. The line slopes downward, just like the upper channel line but it connects lower lows to depict ongoing bearish trends.
-
Price Channel: It is the area between the lower channel line and the upper channel line. It works on price bars that are covered by two parallel lines. In the case of the descending channels, there is a trading range between the paralleled trendlines.
Approaches to Trade with the Descending Channel Pattern
When it comes to trading with the descending chart pattern, it’s important to understand that different trading styles require different methods to give the desired results.
Here, traders have to pay attention to the features and benefits of each method so that it would be easier for them to figure out which one to choose.
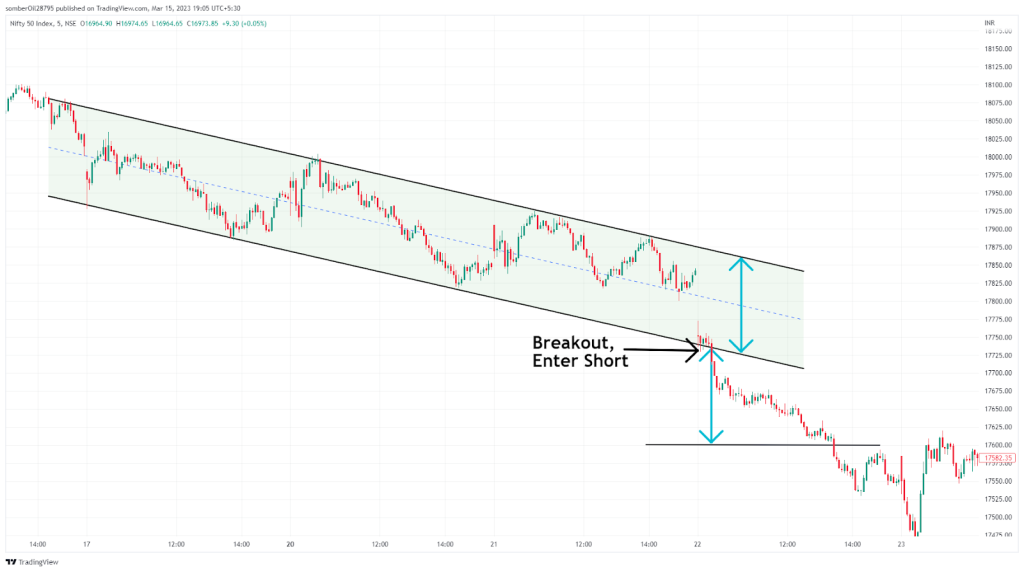
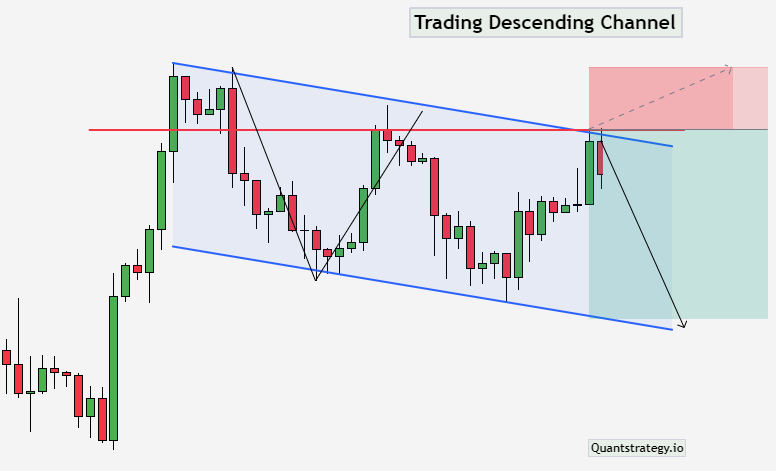
Breakout
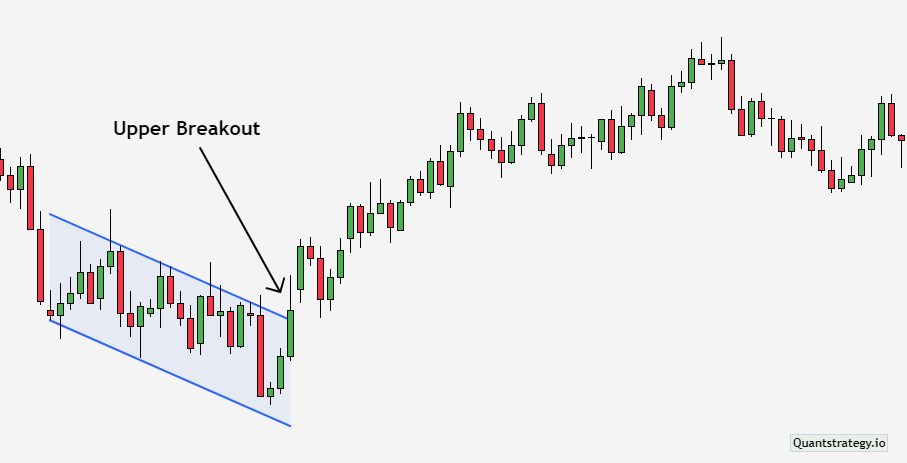
The first and widely used method is trading the channel’s breakout. Not only can traders utilize its upside but they can even trade the downside.
However, they have to watch out for the false breakouts that usually happen when the market is at its higher frequency.
-
Breakout at the Upside: It refers to the possibility of a shift from a bearish trend to bullish one. The trends created influence traders to make a buying decision but, the recommended scenario is to buy after conducting multiple upper-channel examinations. The reason behind this is higher chances of future breakouts leading to short-term price increases followed by rapid fall of the channel.
-
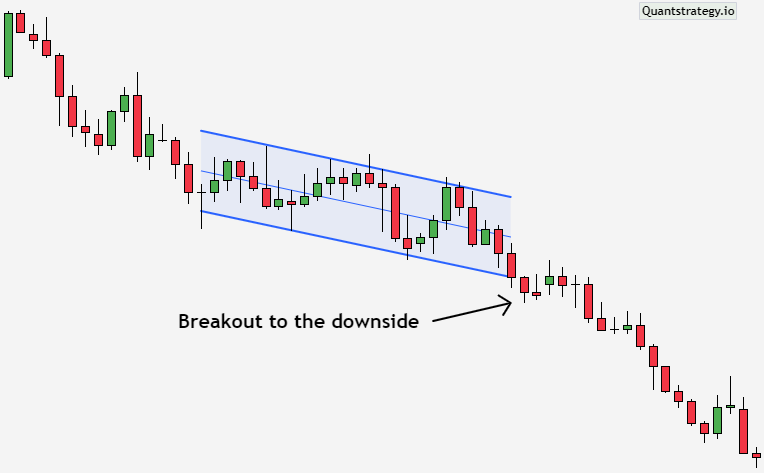
Breakout at the Downside: This method doesn’t often get as much attention as the breakout at the upside. A break right below the lower channel line is evident that the asset has some major weaknesses, which would lead to expansion followed by a new lower channel line. Here, traders have to be prepared for any situation or consequence that may hinder their trade for some time.
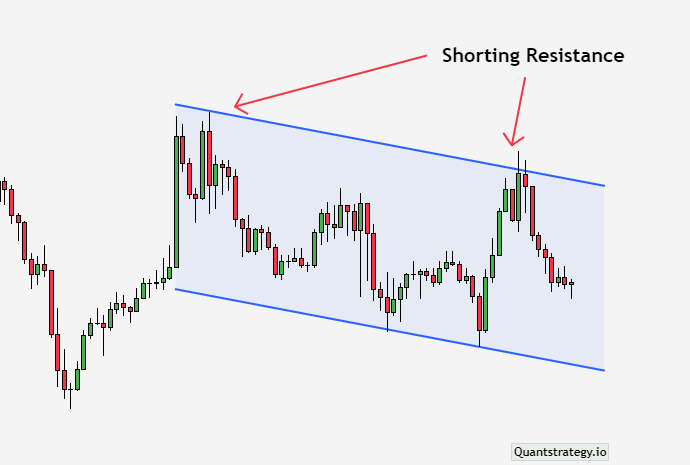
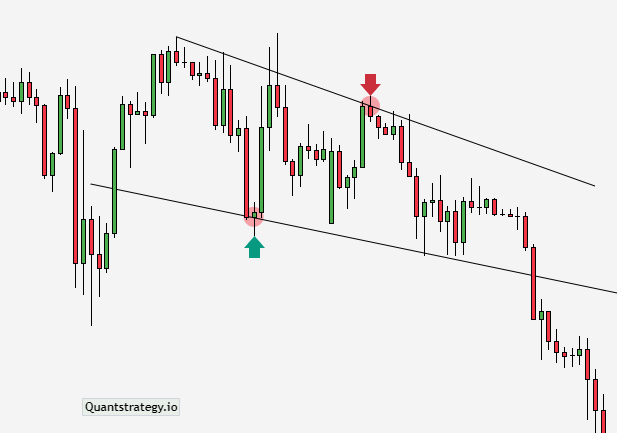
Test the Top of the Descending Channel
All channels are naturally ideal for investors who prefer to play within a certain range.
Also known as the overbought territory, the top of the descending channels shows a higher probability of prices re-entering the inside of the channel.
As soon as the asset touches the upper channel, this phenomenon occurs.
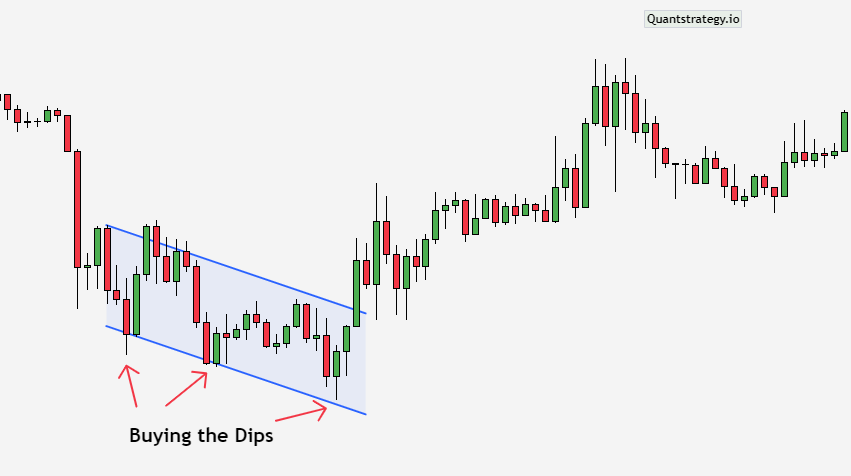
Consider the Test of the Lower Portion of the Descending Channel
Planning to invest in the bottom of the channel is quite tricky since it’s obvious that traders are buying an asset at its weak position.
They have to be prepared for any situation, especially because the stock may keep moving at the bottom of the descending channels instead of bouncing to a better place.
Advantages and Disadvantages of Trading with the Descending Channel Pattern
Just like other technical indicators, the descending chart pattern has a mix of advantages and disadvantages. They help traders to understand the channel in a better way.
Let’s move ahead and get to know about some of them:
Advantages
-
Trends following strategies with descending channel patterns can produce incredible sell-side profits. In a bearish trend, traders can make the most of their investments by riding the channel to claim hundreds of pips.
-
The channel can work for any market in any timeframe. It’s ideal for traders who are searching for multiple trade setups.
-
The channel pattern is known for its strategic flexibility. Traders can apply them to trade breakouts, identify reversals, or follow trends.
Disadvantages
-
Channel patterns can be wide on big timeframes, which makes trading expensive by putting distance between stop-loss locations.
-
The descending pattern contains efficacy at shorter timeframes.
-
The channels can send false signals during market consolidation.
Conclusion
The channel patterns work on bearish trends in the financial market.
They pride themselves on being traded in multiple ways of which, breakout reversal and trend-following strategies are worth considering.
When applied in a flat market, they can send false signals and prove that trends can fade suddenly.
With that being said, they play a significant role in dictating traders about when they should be making a purchase and when to sell.
Frequently Asked Questions (FAQs)
Can traders use the descending channel as a trend-following indicator?
Yes, it can be used. But, no technical indicator can give 100% accurate results. Risk management is crucial while applying the descending channel on a trade.
What’s the right time to use the descending channel pattern?
Usage depends on when and where traders want to apply it. The channel can work in every market during any timeframe. Traders can go for a swing, intraday, or day strategies.
Is it possible to use the descending channel with Stochastics or RSI?
The best part of the descending channel is its versatility to work with numerous indicators. It can work with various momentum oscillators like Stochastics and RSI.


