Time-based charts are often the preferred charting method. This is why tick charts continue to be a mystery to many traders. A tick chart, however, has much to offer, and understanding how to use it effectively in day trading can open up a whole new way of viewing market data, creating more trading possibilities, and maximizing profits.
Tick charts are a distinct and effective tool among the several charting options available.
In this post, we will look at the usefulness of tick charts for day trading and how they can help you obtain a competitive edge in the market.
So, let’s examine why tick charts are important in day trading.
What is a Tick Chart?
A tick chart is a financial chart used in trading to display market activity in terms of transaction volume instead of time intervals. Unlike traditional time-based charts (like candlestick charts or bar charts), where each candlestick represents a fixed time interval, tick charts reflect a set number of transactions or trades. This implies that tick charts create a new bar every time a given/specific amount of trade is executed. For example, a 100-tick chart will display one bar for every 100 deals occurring in the market.
Tick chart speeds vary according to market activity. When the market is busy, tick charts show more bars and details. When the market is slow, they will show fewer bars and noise. You can tailor tick charts to your trading style and strategy by selecting different tick intervals and chart types, like bar, line, or candlestick.
A ‘tick chart’ is commonly referred to as a day trading chart capable of accurately measuring transactions. Those that utilize tick charts claim that they are useful for a variety of reasons.
Tick charts can yield greater information on price movements and volatility. They are especially useful for active day traders who wish to react quickly to stock market developments while also capitalizing on short-term price swings.
Tick charts are useful and simple for determining a trading pattern’s maximum momentum and power. This allows individuals to get the most out of their trading by recognizing the best trading patterns for maximized profits and basing their decisions and moves on them.
A day trader can reap maximum reward by striking the appropriate chord based on these patterns. They measure the number of trades per bar. You can choose several chart sizes; however, the Fibonacci time frame chart is the most preferred. Most traders use them for trading futures or dealing in the forex market and other purposes.
How to Read Tick Charts?
Reading tick charts is like reading other charts. You will often look for price breakouts, trends, and support and resistance. Because you’re working with transaction-level measurements, you’re probably not looking for noteworthy chart patterns (e.g. cup and handle, head and shoulders, etc.) that were supposed to indicate patterns caused by fundamental impulse.
So, when it involves reading tick charts, it is critical to understand how not to read them or how to avoid some patterns that were supposed to offer information in a more comprehensive (and fundamentally driven) way. In other words, do not mix noise with signal, especially if the signal isn’t visible as noise – since market randomness frequently does not appear random.
Because tick charts contain a lot of market noise, you might consider focusing solely on price breakouts, ultra-short-term trends, and support and resistance. In short, explore the chart sparingly and concentrate on the price action directly in front of you.
Similarly, you may want to be mindful of key price levels over an extended time frame. After all, you do not want to miss out on significant support and resistance simply because you were so focused on the microscale that you didn’t notice the larger context around it.
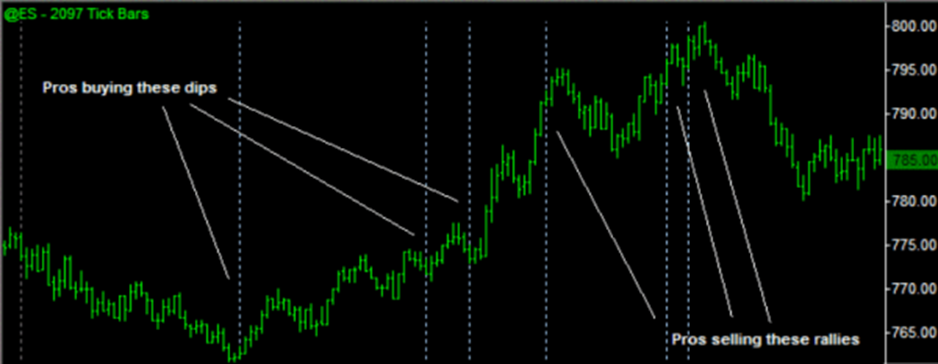
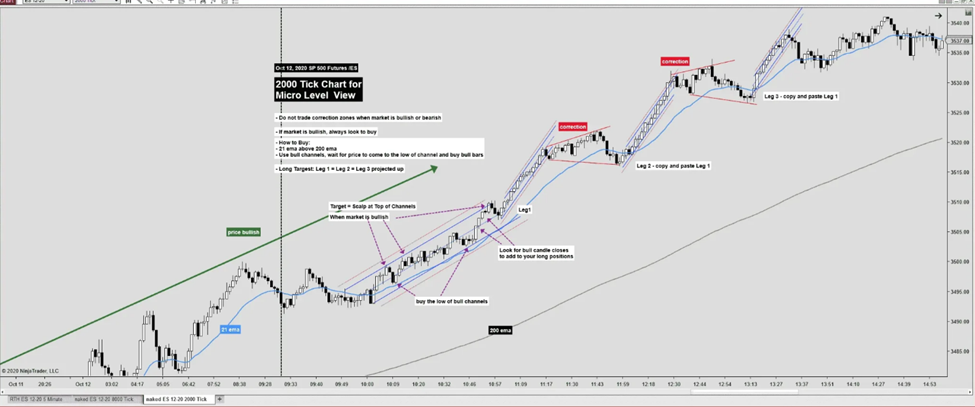
Look at the picture above, and you’ll note that support and resistance, micro-trends, and breakouts are equivalent to those found in other charts. Because you are most likely working with micro-movements, you may wish to focus solely on that dynamic without including any additional theoretical framework. It’s entirely up to you. However, you should remember that this period is more ambiguous than other larger timeframes.
Also, keep in mind that to understand how a tick chart works in real-time and how to trade it, you must first trade it in a live market. Only then can you understand how prices move, how liquidity influences price action, and how slippage can be minimized or taken into consideration.
Employing a Tick Chart for Day Trading

Tick charts, or tick chart trading, are vital for day trading since they provide real-time data. In contrast to traditional time-based charts, traders can instantly notice small price fluctuations. Day traders can profit from market volatility by identifying patterns, setting entry and exit points, employing scalping tactics, and evaluating volume.
Day traders focus on making tiny profits on a high number of transactions while avoiding holding positions overnight. That is why they tend to select more volatile instruments. Tick charts are an excellent way to supplement day trading techniques.
In short, tick charts may assist day traders in identifying profitable market possibilities during times of high and low market activity. For example, when the market begins, volatility and activity are typically strong, and bars might be printed fairly rapidly – even once every minute at first. However, in lunchtime, pre-, and after-hours trade sessions, a single tick could take hours to generate.
Day traders prefer tick charts because they can be modified to match the aggressiveness and sensitivity of the trading strategy. For example, a tick chart can be configured to print a bar on a very small number of transactions. The actual figure could vary on the individual asset, as more liquid securities could have a higher rate of bar printing.
Because it is common for day traders to seek out even smaller market possibilities, they may search for breakouts at the level of even the smallest transactions. This enables them to earn even at the least active times (such as lunchtime) when there are few transactions.
A trader who prefers to trade at larger tick intervals, on the other hand, can set the chart to print a bar with every 1,000 or 2,000 ticks. This adaptability is why tick charts let traders adapt to periods of high or low volume and volatility.
Advantages of Tick Charts
Minimized Distractions
Tick charts enable traders to concentrate on the most significant price movements while ignoring the unrelated ones. A time-based chart can reveal many bars with little or no relevance, particularly during periods of consolidation or low volatility. A tick chart, on the contrary, will display bars when there is sufficient trading activity to create them. These patterns can assist traders in avoiding distractions from noise and misleading signals and focusing on genuine market direction and sentiment.
Detecting Price Movements
Tick charts can assist traders in recognizing price fluctuations driven by high-volume trades, which indicate significant buying or selling pressure. A time-based chart sometimes distorts volume information since it can represent the same volume across different time intervals. A tick chart, on the other hand, displays larger bars for high-volume trades and smaller bars for low-volume trades, irrespective of how long it takes to complete. This can assist traders in identifying potential reversals, breakouts, support and resistance levels, and other price trends that may not be obvious on time-based charts.
Identify Trend Exhaustion
Traders can employ tick charts to identify when a trend is losing strength and may be about to end or shift direction. Time-based charts occasionally give a deceptive impression of a trend’s intensity since they display several bars in the same direction despite low volume and modest price fluctuations. Tick charts, on the other hand, show fewer bars in a fading trend as the number of transactions declines and price changes shrink. Traders can then predict probable trend exhaustion and plan for a likely correction or reversal.
Pre-Market & After Hours Smoothing
Tick charts can help traders comprehend what is occurring outside of a regular market session, like pre-market and after-hours. During these periods, time-based charts can be deceptive, displaying flat lines or long gaps that ignore actual price changes. Tick charts illustrate every deal in the market, no matter the time of day. Therefore, traders can utilize a tick chart to track market activity and sentiment beyond typical trading hours and make adjustments to their trading strategies accordingly.
Tick Chart vs. Other Chart Types – Which Suits You Best?
Tick Chart vs. Time Charts
Tick charts provide an alternate perspective that enhances rather than replaces time charts.
Both have distinct advantages, and the decision is ultimately based on your trading style and interests.
Time charts provide a broader context, whereas tick charts focus on price fluctuations.
Combining them can provide a more thorough view of the market.
Tick Charts vs. Volume-Based Charts
Tick charts show price movements, but volume charts show the number of shares or contracts traded at each price point.
These two chart forms provide distinct insight into market dynamics, and choosing between them comes down to determining which component you value more: volume or price change.
Some traders use a combination of the two to acquire a more complete picture.
Tick Charts vs. Renko Charts
Both Tick and Renko charts focus on price movement instead of time or volume, but there are several major variations.
A Renko chart emphasizes price direction. It creates a new bar for each price movement up or down for a specific number. For example, you may set your charting platform to generate a new Renko bar every time the market moves 10 points higher or lower.
In contrast, a ticks chart is directionless. It simply focuses on activity, establishing a new bar for each particular quantity of trades, irrespective of the direction.
Conclusion
Tick chart trading is an efficient strategy for traders looking to analyze short-term price swings and execute precise trades. Tick charts offer insights that may be particularly useful for day traders and scalpers as they emphasize trading activity instead of time. In volatile markets, their ability to filter out market noise while also reacting to market conditions makes them more successful.
Like any other trading strategy, tick charts have their own set of challenges and limitations. Before using tick charts in their strategies, traders must understand their trading technique, market conditions, and the virtues of tick charts. Traders will be able to make informed decisions regarding which tick charts to add to their trading arsenal after reading this post.