

Candlestick patterns are one of the oldest and most popular methods for analyzing price movements in financial markets. The hanging man is a widely recognized and frequently observed candlestick pattern that can provide valuable information to traders.
In this blog post, we will take an in-depth look at the hanging man candlestick pattern, including how to identify it, what it means, and how to trade it.
What Does the Hanging Man Pattern Look Like?
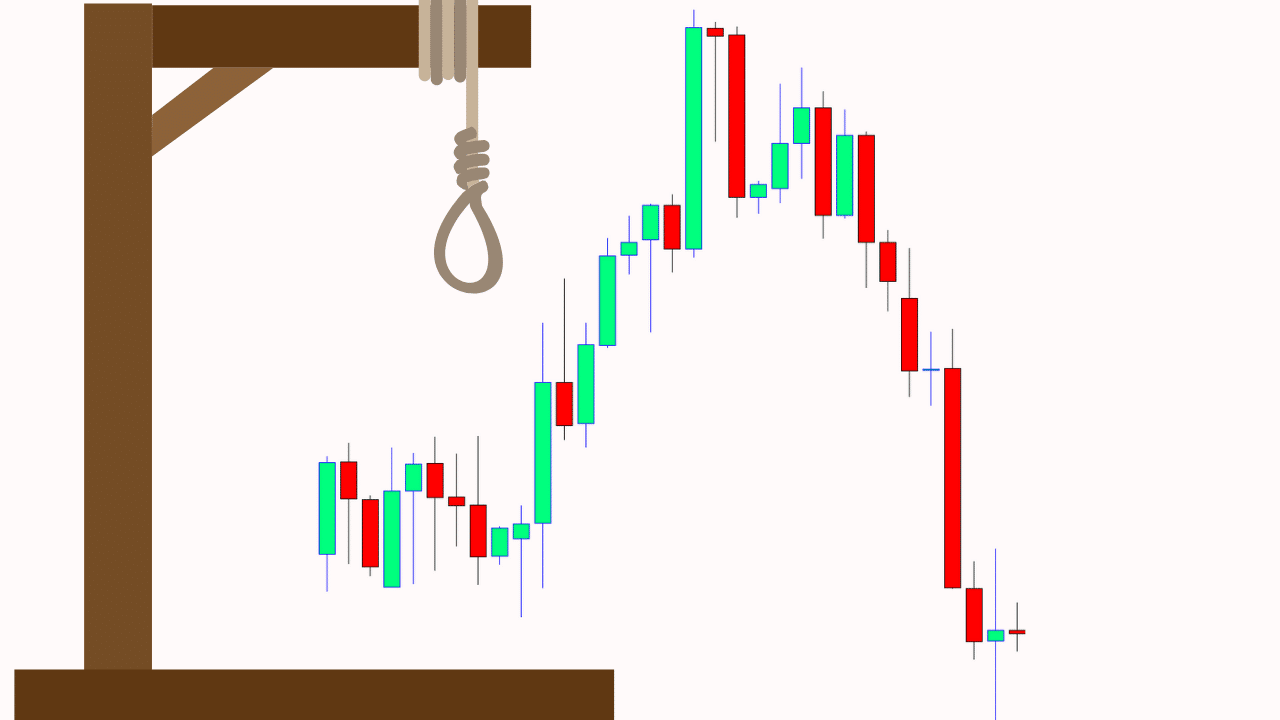
The hanging man pattern is a bearish candlestick pattern that appears as a small body with a long lower shadow at the top of an uptrend. It suggests that bears are taking control of the market and is often accompanied by high trading volume.
Traders can use this pattern, along with other technical analysis tools, to identify potential trend reversals and make trading decisions.
What is a Hanging Man Candlestick Pattern?
A hanging man is a single candlestick pattern that occurs at the end of an uptrend. It is a bearish reversal pattern that signals a potential trend reversal from bullish to bearish.
The hanging man candlestick pattern is formed when the price opens high, trades lower during the day, and then closes near its opening price.
The hanging man has a small body and a long lower shadow, which should be at least twice the length of the body. There should be little or no upper shadow.
Identification of Hanging Man Candlestick Pattern:
The hanging man candlestick pattern can be easily identified on a price chart. Here are the key characteristics to look for:
- The first requirement is that the hanging man pattern should occur after a price uptrend.
- The candlestick has a small body, which is usually red.
- The candlestick has a long lower shadow, which is at least twice the length of the body.
- There is little or no upper shadow on the candlestick.
- The candlestick should occur on high trading volume, which indicates that there is strong selling pressure.
- The next candlestick should open lower, confirming the bearish reversal signal.
What Does the Hanging Man Candlestick Pattern Mean?
The hanging man candlestick pattern is a bearish reversal pattern that indicates a potential change in trend from bullish to bearish. The pattern occurs when the price opens high but then falls during the day, indicating that the bulls have lost control of the market.
The long lower shadow of the hanging man pattern shows that there is strong selling pressure, which could result in a further decline in the price.
The hanging man candlestick pattern is a warning sign for traders that the uptrend is losing momentum and that a bearish trend may be on the horizon.
It is important to note that the hanging man pattern does not guarantee a bearish reversal, but it should be viewed as a signal to take caution and monitor the price action closely.
How to Trade the Hanging Man Candlestick Pattern:
The hanging man candlestick pattern can be traded in several ways, depending on your trading style and risk tolerance. Here are some popular methods for trading the hanging man pattern:
Short Selling: The hanging man candlestick pattern can be used to enter a short sell position, with a stop-loss order above the high of the hanging man candlestick. Traders can take profit at the nearest support level.
Put Options: Traders can purchase put options to profit from a potential bearish reversal signaled by the hanging man candlestick pattern. The expiration date of the put option should be chosen to coincide with the expected reversal period.
Exit Long Positions: If a trader is already holding long positions in the market, the hanging man candlestick pattern can be used as a signal to exit those positions and wait for a clearer direction in the market.
Wait for Confirmation: Traders can wait for confirmation of the bearish reversal signal by waiting for a bearish candlestick to follow the hanging man pattern. This confirmation helps to ensure that the bearish reversal signal is valid and not a false alarm.
Red vs Green Hanging Man formation
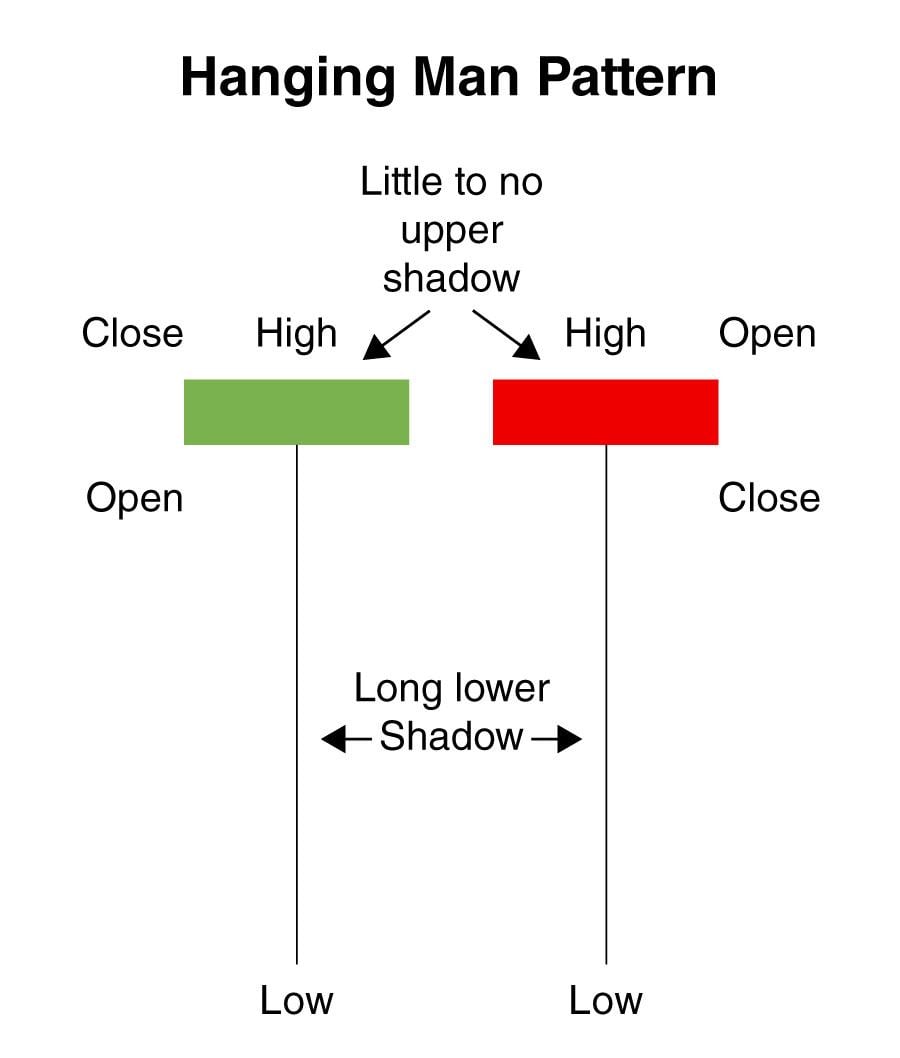
A red hanging man candlestick means that the opening price is higher than the closing price, indicating that the bears were able to push the price down during the trading session. This suggests that the bears are taking control of the market, and a potential trend reversal may be on the horizon.
A green hanging man candlestick, on the other hand, means that the opening price is lower than the closing price, indicating that the bulls were able to push the price up during the trading session. However, the long lower shadow still suggests that bears are taking control of the market, and a potential trend reversal may be imminent.
How to Use Hanging Man Candlestick Pattern to Trade Trend Reversal
The hanging man pattern indicates that the bulls have lost control of the market, and that a bearish trend may be on the horizon.
Here are some steps to follow when using the hanging man candlestick pattern to trade trend reversals:
Step 1: Identify the Hanging Man Pattern
Look for a small red or black candlestick with a long lower shadow and little or no upper shadow. The hanging man pattern should occur after an uptrend and should be accompanied by high trading volume, indicating that there is strong selling pressure in the market.
Step 2: Confirm the Pattern
Once you have identified the hanging man pattern, it is important to confirm the pattern before taking any trading action. This can be done by looking for a bearish candlestick to follow the hanging man pattern. The bearish candlestick should close below the hanging man’s lower shadow, indicating that the bears are taking control of the market.
Step 3: Place a Stop-Loss Order
When trading the hanging man pattern, it is important to place a stop-loss order to limit potential losses. The stop-loss order should be placed above the high of the hanging man candlestick, as this is the level at which the bullish trend would resume if the pattern were invalidated.
Step 4: Take Profit
Once the pattern is confirmed, traders can take profit at the nearest support level. This is the level at which the price is expected to find support and bounce back up after a decline. Traders can also use other technical analysis tools, such as trend lines, moving averages, or Fibonacci retracements, to identify potential support levels.
Step 5: Manage Risk
As with any trading strategy, it is important to manage risk when trading the hanging man candlestick pattern. Traders should never risk more than they can afford to lose and should always use appropriate position sizing and risk management techniques. Additionally, traders should be aware of potential market volatility, news events, and other factors that can affect market conditions.
Hanging Man vs. Hammer vs. Shooting Star: The Differences
Hanging man, hammer, and shooting star are three popular candlestick patterns that traders use to analyze market trends and make trading decisions. While these patterns share some similarities in appearance, they have distinct differences that traders should be aware of.
Hanging Man:
- A bearish reversal pattern that appears after an uptrend.
- The body is small with a long lower shadow and little or no upper shadow.
- Indicates a potential reversal in trend and that bears may be taking control of the market.
Hammer:
- A bullish reversal pattern that appears after a downtrend.
- The body is small with a long lower shadow and little or no upper shadow.
- Indicates a potential reversal in trend and that bulls may be taking control of the market.
Shooting Star:
- A bearish reversal pattern that appears after an uptrend.
- The body is small with a long upper shadow and little or no lower shadow.
- Indicates a potential reversal in trend and that bears may be taking control of the market.
The main difference between the hanging man and the hammer is their location in the trend. The hanging man appears at the top of an uptrend, while the hammer appears at the bottom of a downtrend.
The shooting star is similar in appearance to the hanging man, but the long upper shadow indicates that the bulls attempted to push the price higher during the trading session, but were ultimately unsuccessful.
Key Takeaways
The hanging man pattern is a bearish candlestick pattern that appears at the top of an uptrend and suggests a potential trend reversal.
It is important to use appropriate risk management techniques to limit potential losses when trading the hanging man pattern.
The hanging man pattern should not be confused with the hammer or shooting star patterns, which have similar appearances but signal different trends and locations in the trend.
Traders should look for confirmation of these patterns before making any trading decisions and use appropriate risk management techniques to limit potential losses.
Conclusion
The hanging man candlestick pattern is a popular and widely recognized candlestick pattern that can provide valuable information to traders. It is a bearish reversal pattern that signals a potential change in trend from bullish to bearish.


