

In his 1988 classic, “How to Make Money in Stocks,” American engineer William J. O’Neil established the cup and handle (C&H) pattern, adding technical criteria in a series of articles published in Investor’s Business Daily.
In today’s blog post, we will talk about the cup and handle chart pattern. You will learn what a cup and handle figure is and what it can tell a trader, analyst, or investor, we will also give an example of using this pattern in trading and answer the most popular related questions.
What Is a Cup and Handle Pattern?
Price patterns that look like the cup forms and handle are technical patterns indicator that has a cup shaped like a “U” and a handle that drifts downward. The right side of a cup and handle pattern usually sees less volume, which is a bullish continuation pattern signal. Pattern formation can take anywhere from 7 to 65 weeks.
IDENTIFYING THE CUP AND HANDLE PATTERN
We need to know about the cup and handle pattern so for, we first need to know about the main parts that combine to make this pattern. Let’s explain the cup & handle first.
Explanation of the Cup and Handle Pattern
The Cup and Handle Chart Pattern begin with a “U-shaped” curve, forming the cup or rounding bottom. The bottom of the cup represents the low point of the stock’s price. It is important to note that the cup’s shape can vary, with some being shallower or deeper than others.
The depth of the cup (the lowest point of the U-shape) should be no more than one-third of the previous advance. However, in volatile markets where there may be overreactions, the depth of the cup could range from one-third to one-half of the previous advance. In extreme situations, the maximum depth of the cup could be two-thirds of the previous advance, which is in line with the principles of Dow Theory.
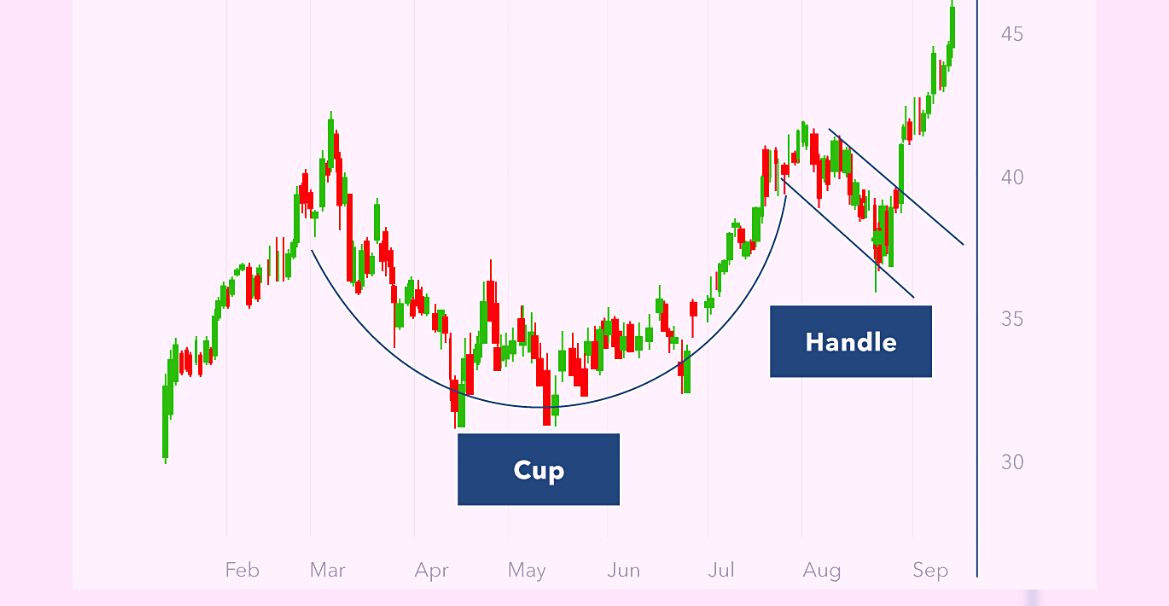
After the cup formation, the stock’s price usually enters a period of consolidation, forming the handle. The handle formation is typically shorter in duration than the cup and takes the shape of a smaller, downward-sloping channel.
The handle’s bottom is usually slightly above the cup’s midpoint. If we shall talk about the Cup pattern’s height and length usually, in an ideal formation, the height of the handle rarely exceeds a third of the height of the cup and the length should be no more than ⅙ the length of the cup.
How to Identify the Pattern
The cup and handle pattern is a technical analysis pattern used by traders to identify potential bullish breakouts in a stock’s price. Here are the steps to identify the cup and handle pattern:
Look for a prior uptrend
Before the cup and handle pattern can form, the stock or market must have been on an uptrend for some time. The stock is in high demand, which indicates that it is in high demand.
Gradual dip
The cup and handle pattern starts with a gradual dip in the stock price, followed by a period of consolidation where the price trades in a range. This forms the “cup” portion of the pattern, which resembles a U-shape.
Symmetrical look
The high price points on both sides of the cup should be almost the same, giving the cup a symmetrical appearance.
Sharp decline
After the cup formation, there is typically a sharp decline in the stock price, forming the “handle” portion of the pattern. The handle is a downward-sloping consolidation period, which typically lasts 1-4 weeks.
Bullish reversal
Once the handle is formed, the stock price should start to rise again, indicating a bullish reversal in the trend. Traders may look for entry signals to go long on the stock.
Factors to Consider Before Trading
The cup with handle pattern to trade, there are a few things to consider

Confirm the pattern
It’s important to confirm that the cup and handle pattern is actually present and not a false signal. This may include looking for a breakout from the handle’s consolidation period, accompanied by higher trading volume and a price increase above the handle’s resistance level.
Time Frame
Another thing to consider while trading is the time frame, the cup and handle pattern may take weeks or even months to form, so traders should be patient and not rush into trades.
Market Conditions
Considering the overall market condition is also the most important thing look at the overall market conditions and trends to determine if it is conducive to trading the cup and handle pattern. If the market is choppy or volatile, it may not be the best time to trade this pattern.
Stop Loss
Just as with any pattern on a chart, a skilled trader must always consider the implementation of stop losses in their trading strategy. Stop losses are put in place to restrict the possible loss of a trade. Once the limit of the stop loss is met, the stock or asset is sold at the predetermined limit price. By utilizing a stop-loss order when dealing with both the cup and handle, as well as the reverse cup and handle patterns, a trader can greatly reduce their losses. With a stop loss integrated into their trading plan, traders can effectively evade needless losses and retain a significant portion of their trading balance.
Trading Mistakes in the Cup and Handle Pattern
Buying too early before the handle has developed is a common mistake that traders make when attempting to trade the cup and handle pattern. Remember that the handle should preferably develop no more than 15% below the cup’s left high. If it falls below this level, it may indicate that the stock is not yet ready to break out and move upward.
Another mistake traders make is failing to appropriately manage their risk. Because the cup and handle pattern is seen as a trustworthy indication, traders may forget that it can (and will) fail at times. As a result, you must always account for and plan for such circumstances.
How to trade with Cup and handle model Example
The image is a monthly chart from the popular hotel and casino company Wynn Resorts Ltd. The chart displays a Cup and Handle formation with an obvious prior upswing, as demonstrated by the trend line with higher highs and lower lows. A moving average can also be used instead to confirm the uptrend.
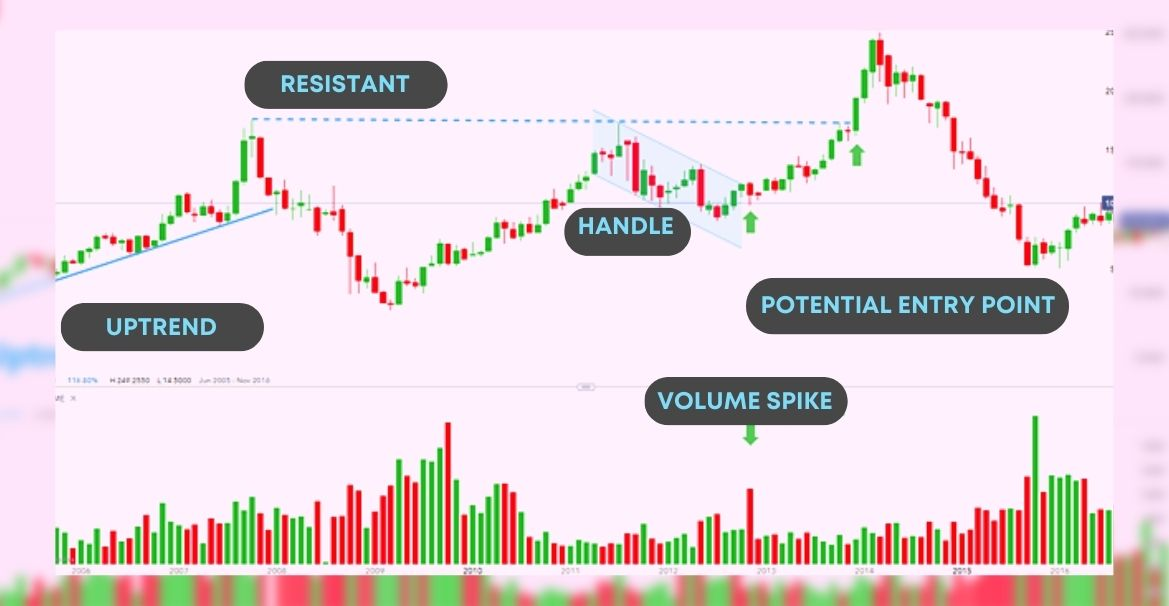
The graph shows two potential entry points indicated by green arrows. The first entry takes place on the break above the upper end of the bullish flag-like price channel with a volume spike as verification of the upward move. The second entry uses the resistance level between the highs on both sides of the cup as the key price level. Once this is broken, traders can look to move forward. This method is less aggressive, but being patient with one more confirmation can protect against a false breakout with respect to the channel handle.
Stop levels are often taken from the bottom of the handle. This can then be projected by a factor of two to arrive at a (limit) profit with a 1:2 risk-reward ratio. Other traders prefer Fibonacci extensions as an indicator of borderline levels. This choice depends on the trader’s preferences.
Limitations of Cup and Handle Pattern
Before making a trading decision, the cup and handle, such as all technical indicators, should be used in conjunction with other signs and indications. Particularly with the cup and handle, some limitations have been identified by professionals.
The first is that it can take some time for the model to fully form, which can lead to late decisions. In some cases, it takes several years to become established, or it can happen very quickly, making the timeframe ambiguous.
Another issue has to do with the depth of the cupped portion of the formation. A shallower cup can sometimes be a signal, whereas a deep cup can generate a misleading signal. The cup is sometimes made without the typical handle. Finally, a limitation shared by many technical models is that it can be unreliable in illiquid stocks.
Conclusion
The Cup and Handle Chart Pattern is a powerful tool for identifying potential bullish trends in the market. By applying the strategies outlined in this article and continuously learning from real-life examples, traders and investors can increase their chances of success and maximize their profits.


