Finding patterns that indicate probable market reversals is essential in the trading business. The rounding bottom chart pattern is one of them. They are a relatively famous reversal pattern that occurs when new trends are about to form.
The rounding bottom pattern closely resemble the cup and handle pattern and applies to all assets, including exchange-traded funds (ETFs), forex, stocks, currencies, and commodities. It is the opposite of the rounding top chart pattern.
In this article, we’ll have a closer look at the rounded bottom pattern and how to trade the rounding bottom chart pattern effectively using risk management and technical analysis strategies.
What is a Rounding Bottom Pattern?
The rounding bottom chart pattern, also referred to as the ‘saucer’ bottom pattern, is a long-term reversal pattern that best suits weekly charts. It represents a protracted period of consolidation that shifts from a bearish to bullish trend.
When the pattern forms, it indicates that the price of an asset will begin moving in a certain direction. It has the shape of the letter U.
It occurs when the price decreases over time but then moves up and creates a bottom. It takes time to form. This time frame can be minutes, weeks, months, or even years for the pattern to form completely.
The rounding chart bottom pattern is often observed in penny stocks as their prices are extremely volatile, rendering it easy for investors to spot them.
The pattern indicates that an existing downtrend is about to end, and a possible uptrend is about to commence.
The price chart below demonstrates a rounded bottom applied on the gold chart.
How to Identify a Rounding Bottom Chart Pattern?
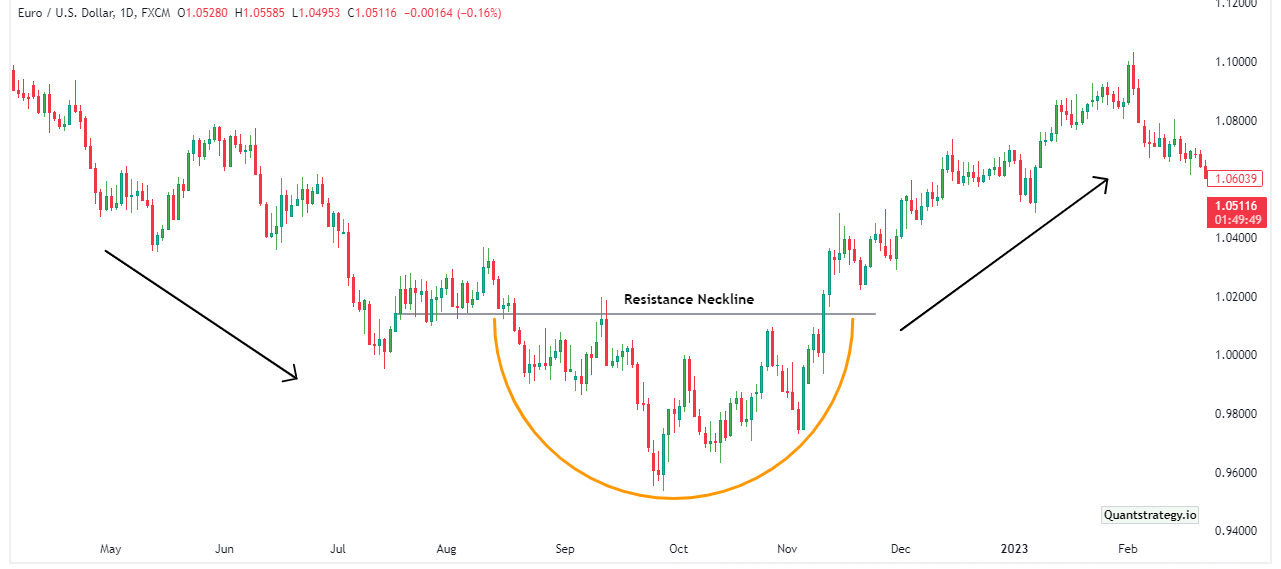
The rounding bottom emerges when the price of a financial asset creates a trough in a bearish bias and rebounds, forming a curve gradually that gets more prominent as the rally goes on. It is generally confirmed when the asset breaks above the resistance level, called the neckline.
The resistance or neckline is a technical resistance level that makes a horizontal line linking the high points in the rounded bottoms where the financial market has fought to break above.
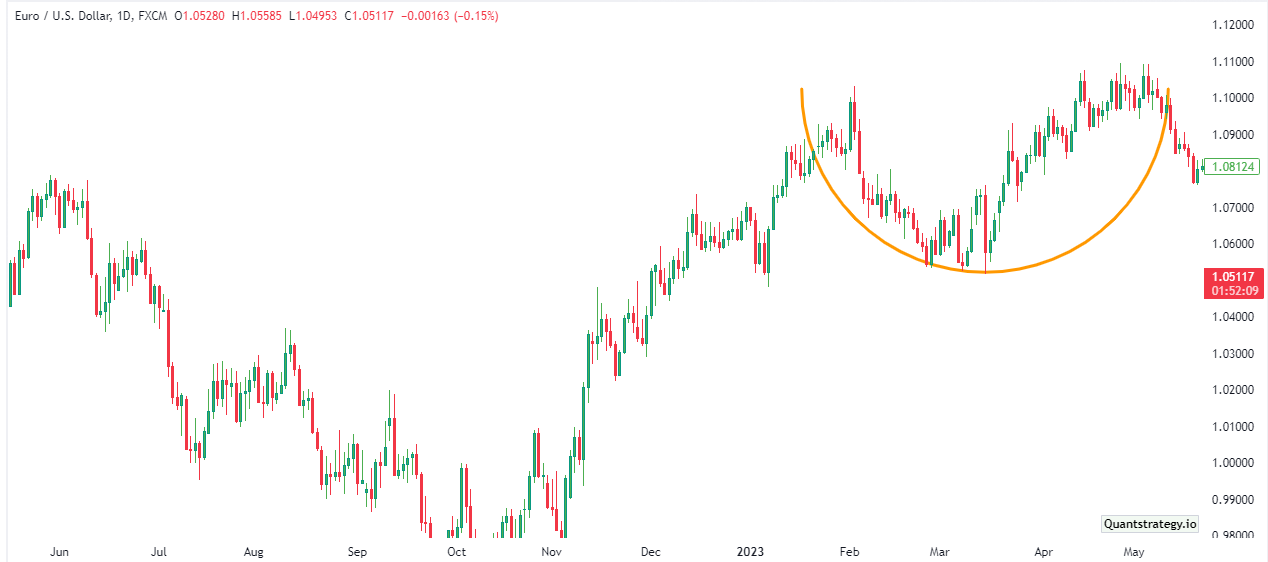
We can identify the rounding bottom on the M30 chart of EUR/USD below. Traders can categorize it into several main areas.
First, the price of the financial asset decreases, indicating that there is little demand for it. Excess selling is not evident in the formation. Second, the price reaches a low point and begins rising upward gradually. The critical level to observe when the rising trend begins is typically where the downward pattern first developed. This is generally when the trend encounters resistance. As the aforementioned chart illustrates, the price usually encounters additional resistance at this level. In fact, at this point, the price may drop or encounter consolidation (neckline).
Rounding Bottom Pattern VS Cup and Handle Pattern
The rounding bottom pattern and cup and handle chart pattern formation have a close resemblance. But certain differences should be noted to prevent confusion. Rounded bottom points towards a trend reversal, while the cup and handle indicate a trend continuation.
A rounding bottom features a bullish reversal arrangement, and the cup and handle are usually a bullish continuation setup.
To differentiate between the two, try looking for a handle – the rounded bottom doesn’t have one.
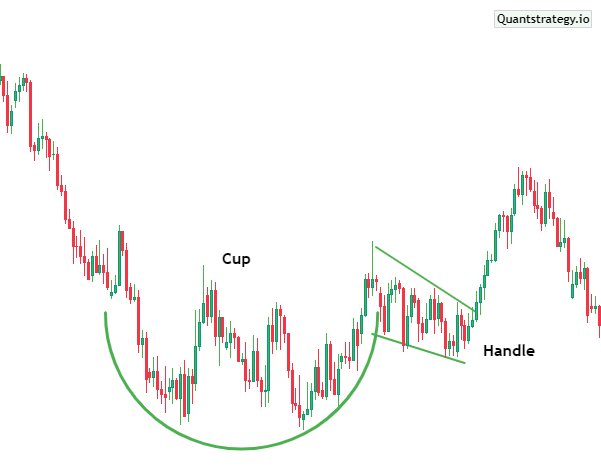
The prices make a trough following a bullish trend in the cup and handle pattern and then increase to resistance; however, the uptrend ends before a handle forms. The continuance of the uptrend is only indicated by a breakout above the handle.
The rounding bottom formation has no handle. Rather, the bullish trend is maintained as the market moves forward.
Trading the Rounding Bottom Pattern
Like other bottom chart patterns and trend reversal patterns, trading with a rounding bottom pattern is straightforward. You’ll be trying to enter a long position when the price trades above the neckline resistance level and swings in a new direction, much like the double and triple bottom pattern.
However, it is advised against using the pattern by itself. You should instead use it in conjunction with other technical indicators and trading systems.
Here is a step-by-step guide, which will help you trade with the rounding bottom pattern most virtually.
Identify the Rounded Bottom and Confirm the Breakout
Find a price decline, which gradually changes to a range, followed by a price increase, to confirm the rounded bottom. High volumes throughout the decline, flat volumes during the range, and rising volumes during the reversal are your best confirmations.
After identifying the pattern draw the neckline. This can be done by drawing a horizontal line over the top of both the bearish and bullish sides of the rounded bottom pattern.
Next, the rounded bottom breakout occurs when the price pierces the neckline in a bullish manner. The stock should demonstrate strength once it breaches this neckline by expanding in price and volume.
Using it with another Technical Analysis Tool
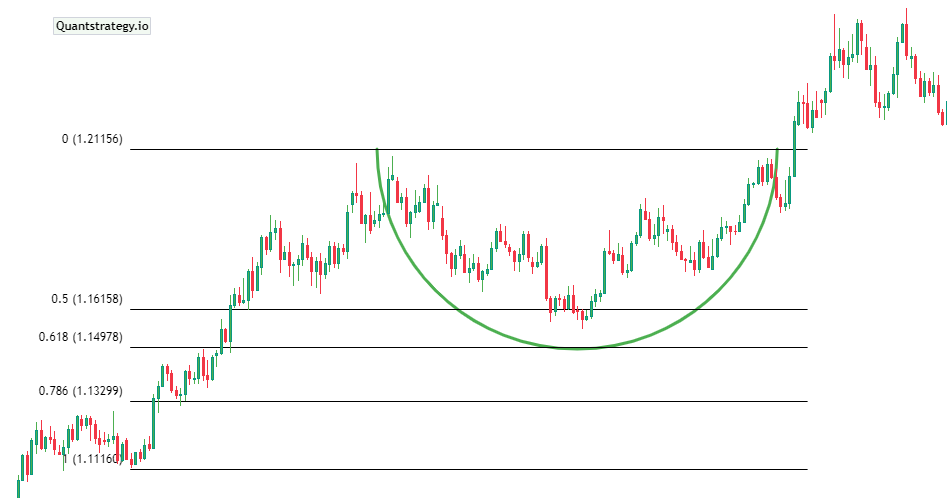
Since the rounding bottom pattern is a trend reversal candlestick pattern, it can be used with other trend reversal technical analysis indicators such as the Fibonacci Retracement.
Fibonacci retracement levels are one of the most valuable indicators to use with rounding bottom patterns.
To use this indicator, you require to draw Fib lines that extend from the highest level of the prior trend to the lowest point in the rounding bottom area.
The price chart below illustrates that the lower point of the rounded bottom happened at a 50 percent Fibonacci retracement level.
Entering a Long Position
Traders can enter long when the price breaks through the neckline. It’s best to hold off until the first candle after the breakout closes above the neckline.
Setting the Stop Loss Order
You can buy the asset at its lowest point and hold it until it reaches the resistance level. You can guard this trade by setting a sell-stop order below the pattern’s lowest point, you can hedge this bet.
By doing this, a sell trade will be started, invalidating the bullish perspective.
The rounding bottom pattern can also be traded using a different method. You might set a buy stop above the resistance level after exiting at the resistance level. By doing so, you are placing a bet that the price will move in the same direction.
Take Profit
Some traders deploy a formula to place a take profit on their investments. They evaluate the distance between the trough and the neckline resistance level and use that figure as they go from the neckline toward the top.
Conclusion
Using effective risk management techniques and maintaining a positive outlook are essential in trading. While rounding bottoms can provide useful trading signals, it’s important to consider that they can also give false signals. Before making a trading decision, investors must do thorough research and look for confirmation from other indicators.