

In stock markets, we can rely on a bunch of ways to spot a trend reversal. Candlestick patterns are one of these, which can help traders identify them effectively. In this article, we’re going to learn one of the many bearish reversal patterns for successful trading. And here, we are referring to the three black crows candlestick pattern.
What is the Three Black Crows Pattern?
We know that Japanese candlesticks are a well-known chart type for price analysis. They are informative, easy to read, and used by traders for predicting future market movements.
Traders, at some point, developed the thought of recognizing the candlestick patterns. They typically resemble a sequence of candlesticks, following which the price moves in one direction or another. Three black crows pattern is one such design employed by traders when looking for reversal candlestick patterns on a chart.
It shows a bearish candlestick pattern, which predicts reversal of an uptrend. The candlestick is white or green for stocks going higher. They demonstrate a red or black color when moving lower. The name comes from the past when the candlestick charts were of black and white color.
Now that we know the three black crows’ definition let us move to the pattern itself.
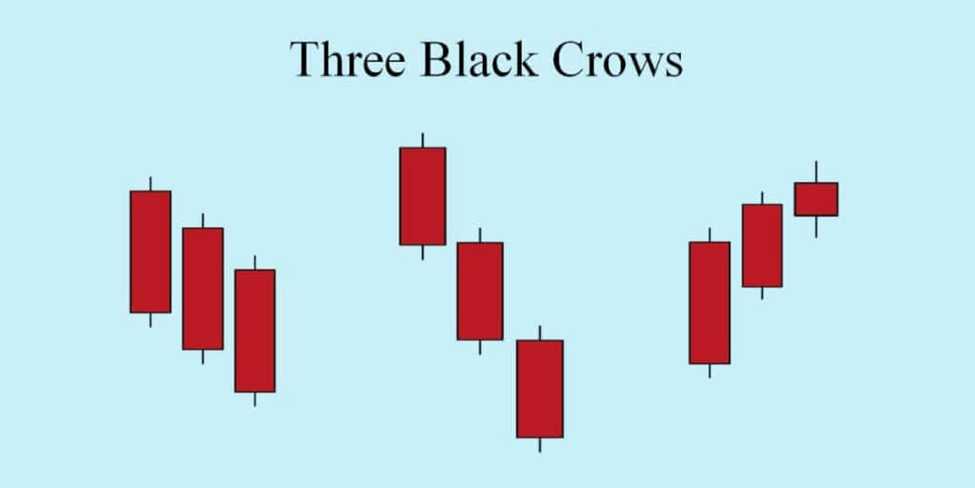
The three black crows pattern is a multiple candlestick chart pattern that embodies three consecutive bearish candles. These bearish candlesticks open inside the actual body of the previous candle and close below the previous candle. Typically, the candles have little to no wicks, indicating that bears have taken entire control of the situation. It takes three consecutive trading sessions for bears to surpass bulls.
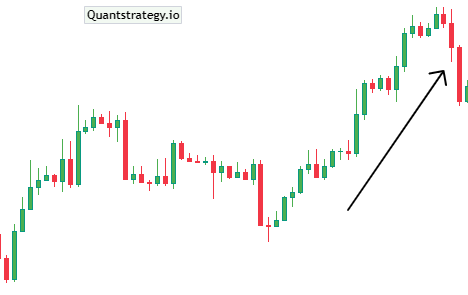
For instance, the trading day that followed a bullish day began with a little upward increase. Later that day, the price fell to a lower point than the day before as bears grabbed control. The price decreased every day for the next two days as well. By the end of the trading session, the bears’ constant pressure caused the prices to close near the day’s lowest point. Once finished, the pattern typically resembles the image below.

The three black crows candles is a trend reversal pattern, which should only be taken into account when it develops in an established uptrend. It is a visual pattern, which means that no specific calculations are required when identifying it.
The Three Black Crows typically signal a break in an established uptrend as well as the probable start of a downward trend. Or stated another way, it signals a change in control from bulls to bears.
Traders use three black crows pattern together with other chart patterns or technical indicators to verify the reversal.
The author Steve Nison says in the book “Japanese Candlestick Charting Techniques” that three black crows is one of the most useful patterns for longer-term traders.
Identification Criteria
In order to identify the three black crows candlestick pattern, it should meet the following criteria.
- A prevailing uptrend should be present.
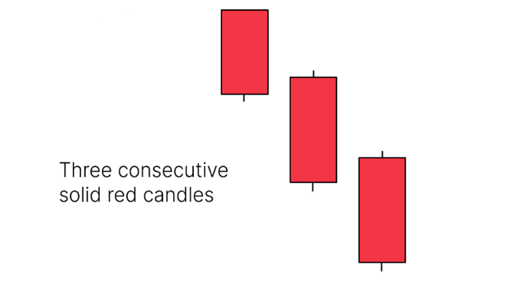
- There must be three consecutive long bearish candlesticks.
- Each candle should open beneath the opening of the earlier day.
- It should ideally start in the middle of the previous day’s price range.
- Each candle must gradually close lower, creating a new short-term low.
- The bottom wicks of the candles are very little or absent.
How to Interpret the Three Black Crows Pattern?
The three black crows pattern is a bearish reversal pattern that indicates a strong selling trend.
This pattern is represented by three consecutive long black candlesticks that open higher than the previous candlestick’s close and continue to drop significantly. To interpret this pattern, traders need to look for confirmation of the downtrend’s strength by checking for lower highs and lower lows. This pattern usually occurs after an uptrend or at the peak of a range, and a break below the previous low confirms the bearish trend’s continuation.
Traders also need to keep in mind that the three black crows pattern is not always a perfect indication of a downtrend. There may be instances when bullish signals may emerge after the pattern, and traders need to be cautious of such events.
It’s important to use additional technical indicators to confirm the validity of this pattern and to implement sound risk management practices to avoid significant losses.
hree Black Crows & Three White Soldiers
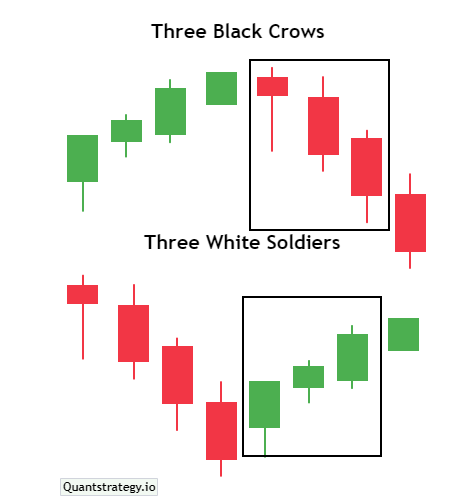
Like several candlestick patterns, three black crows also has its inverse twin. It is called the three white soldiers that work similarly to the setup discussed above and depend on similar goals shared by market participants. However, the two differ in several critical ways as well.
While the black crows candle pattern entails three consecutive long bodied bearish candlesticks, the three white soldiers pattern has three consecutive bullish candles. The three black crows is a bearish reversal pattern that forms during an uptrend and indicates a selling opportunity, whereas the three white soldiers is a bullish reversal pattern that forms during a downtrend and indicates a buying opportunity.
Trading the Three Black Crows Pattern
Now that you have learned what the three black crows pattern is, we can get into the trading aspect.
First candle
You should look for an uptrend and wait for the first candlestick to emerge. The color must be red, and it can either be a long or small bearish candle, which is at least half of the earlier one, indicating that sellers have entered the game.
Second candle
You are not required to open a trade straight away but watch at the second candle. The second candlestick should also be red and have a size similar to the first one. Its opening price should lie within the initial red candle’s body. It is preferred that the second candle’s opening price lies between the closing price and the midpoint of the previous candle. Moreover, the candle must not break the high price of the earlier candle.
Third & last candle
After this, you will observe the third candle. The chart looks like the figure below. Again, this candle can either be small or long and should be red in color. Its opening price must be within the candle’s body of the previous day. It’s preferable that its opening price lies between the closing price and the midpoint of the second day’s candle. The candle must not break the high price of the earlier candle.
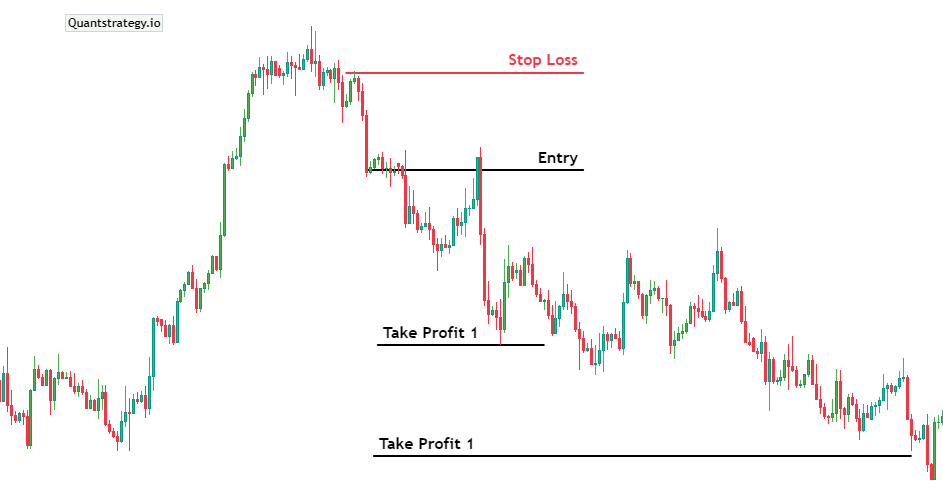
Entry Point, stop loss and take profit
You can now open a sell trade as soon as the third candle closes. Your stop loss can be placed above the first candle, and at the very least, your take profit should be as far as your stop loss. According to risk management guidelines, the take profit must be twice as far, however, we advise closing half of the deal on the way in order to reduce the risk.
Conclusion
The three black crows is a staple pattern used in candlestick trading. It represents a bearish reversal candlestick pattern that’s typically used in technical analysis to predict a specific uptrend reversal. Traders often use other technical indicators and chart patterns in combination with it to confirm the reversal. Understanding three black crows pattern is essential for traders trying to boost their long-term performance.


