


A huge variety of indicators is available for usage in the technical analysis sector. Detrended Price Oscillator (DPO) is one such technical indicator that efficiently reduces the noise in price movements.
Many traders are unaware of this indicator because it is not included by default in some of the widely used charting software.
In this article, we will discuss what DPO is and How to use Detrended Price Oscillator in trading strategies.
What is a Detrended Price Oscillator (DPO)?
As the name indicates, the term detrend is the opposite of trending. It is a technical tool created by William Blau in 1991 that attempts to eliminate long-term trends in an asset’s price by employing a displaced moving average.
With this technique, the Detrended Price Oscillator (DPO) can effectively filter out the current price action, allowing it to instead focus on identifying overbought and oversold levels at intermediate intervals. This means that any cycles longer than the indicator’s defined period are removed, leaving only the shorter-term ones.
It is important to note that the DPO is not a momentum indicator, but rather, it serves as a valuable tool for evaluating cycle high and low points.
By estimating the length between peak to peak and trough to trough, traders can better understand the market’s behavior and use this information to their advantage.
The Detrended Price Oscillator is not usually aligned with the most recent prices. It is shifted to the left to align it with the price’s peaks and troughs.
The reasoning for this is that detrended prices, which ignore larger price upswings or downswings, can help traders understand the buying and selling pressure based on short-term variations in the price of an asset.
How does the DPO work?
The Detrended Price Oscillator (DPO) separates short-term cycles from long-term cycles. It does it by comparing the closing price to the prior moving average close to the middle of the selected period.
When readings are higher than the simple moving average, it signals that the DPO indicator is at overbought levels. On the other hand, when readings are lower than the simple moving average, it indicates that the DPO is at oversold levels.
It can indicate a possible reversal in price direction if the DPO indicator reaches an extreme value. These indications can be used by traders to enter or exit trades in advance of a market reversal.
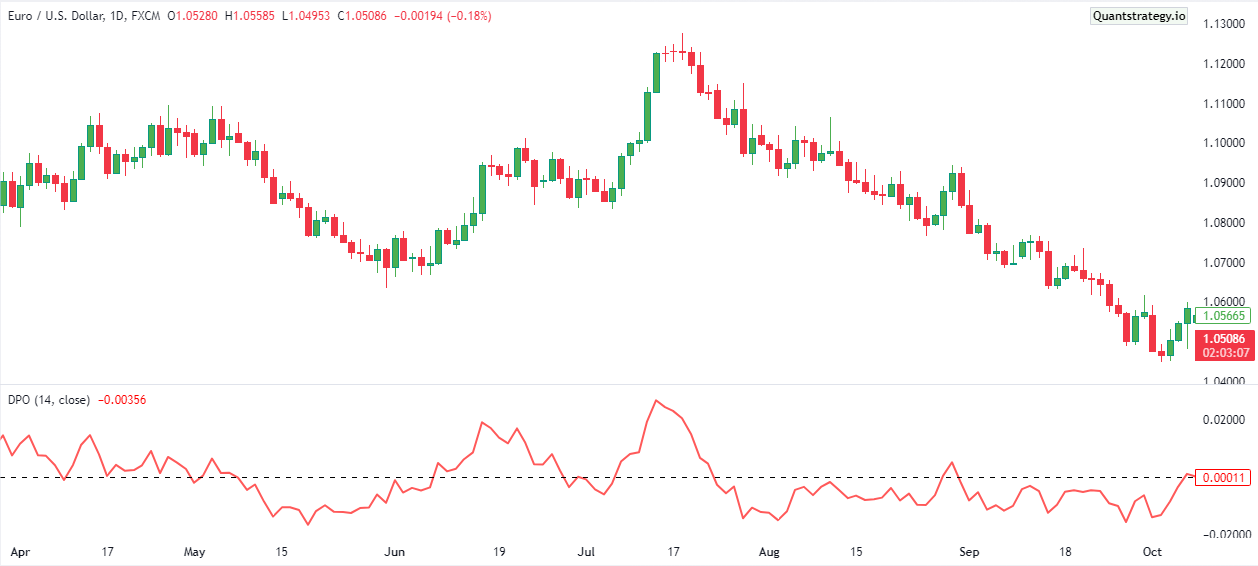
The DPO standard setting is 20 periods. The DPO oscillates around zero level, and if we take the 20-day DPO, it will eliminate cycles longer than 20 days.
Detrended Price Oscillator Formula
The Detrended Price Oscillator formula is
DPO = Closing Price from (N/2 +1) periods ago minus Simple Moving Average(N),
where N is the indicator period.
In order to calculate the Detrended Price Oscillator, it’s necessary to select a period, such as 20 days.
To get a middle point of the period Divide this number by 2, and add one.
n periods = (N/2) + 1
If you are using 20 days, then the n periods will be 11.
Next, calculate the simple moving average of the selected period, which is 20 in this example, and subtract this from the closing price of the asset for the n period. The resulting value is the DPO.
Detrended Price Oscillator Trading Strategies
The DPO should never serve as the sole signal for buying or selling; instead, it should be utilized in conjunction with other indicators.
It functions mostly as a confirming signal. In reality, whenever utilizing Detrended Price Oscillator Strategies or any other price oscillators, always remember to evaluate your risk tolerance, define boundaries, and choose stop-loss using ATR.
Using the Zero Line
One of the most common ways of using the Detrended Price Oscillator indicator is employing the zero line.
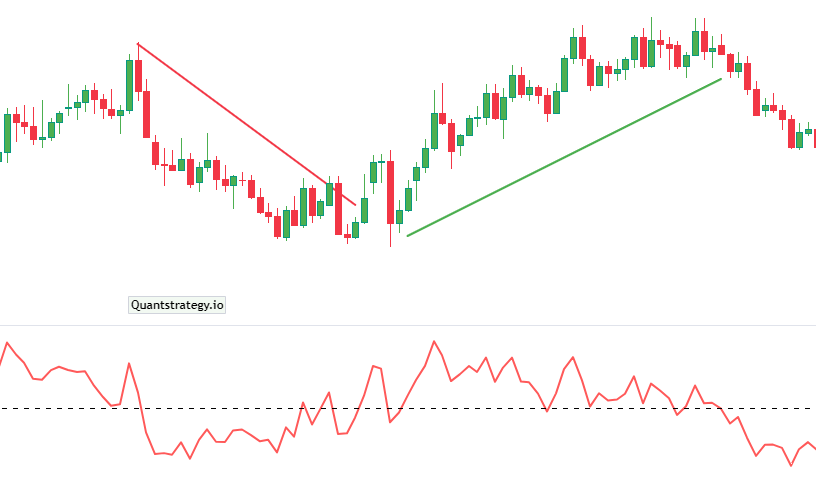
The idea behind this trading strategy is that a buy signal can be confirmed when the Detrended price line is moving mode the zero line and rising.
Similarly, a sell signal is confirmed if the DPO line moves lower and remains below the zero line. However, it could be wise to exit the trade if the price movement diverges from the Detrended Price Oscillator (DPO) signal.
The below DPO chart depicts a good example of using a zero line.
Using the DPO with Moving Averages
The DPO can be effectively employed in combination with moving averages for greater accuracy.
The goal of this strategy is to merge a trend indicator that identifies a shift in direction with one that confirms the overall trend.
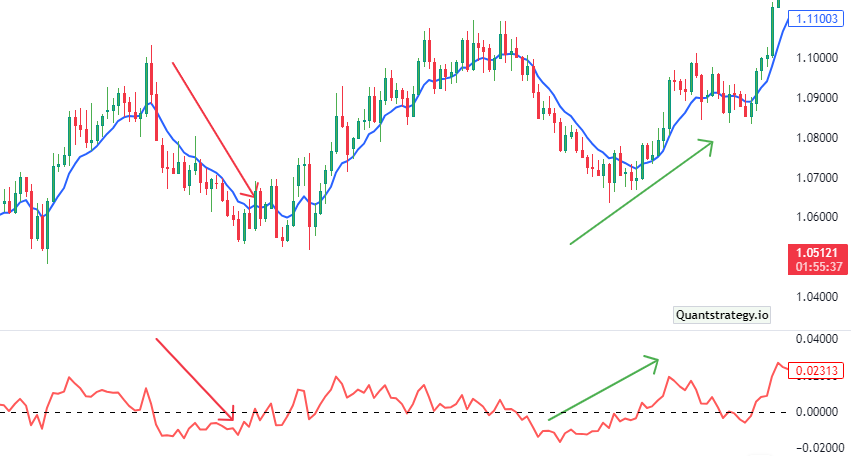
Our favorite strategy employs a double exponential moving average with the DPO. We find the EMA to be more precise as it highlights recent closing prices.
In our approach, we use a 21-day DPO in conjunction with both 21-day and 10-day EMA. The reason for this is to effectively identify new trends through crossovers with the double EMA. To validate the trend, we check the DPO for any signs of reversal and then combine these signals to confirm an ongoing trend.
Limitations of the Detrended Price Oscillator (DPO)
Like other oscillators, the DPO is a lagging indicator. It represents past data, so it may not predict future price movements accurately. It is up to the judgment of the trader if the Detrended Price Oscillator confirms a buy or sell signal that might or might not hold in the future.
Additionally, this indicator can produce false signals, particularly during times of sideways price action or in highly volatile markets.
Difference between Detrended Price Oscillator and Commodity Channel Index
Both these indicators try to identify cycles in price movements, but they go about it very differently. The DPO is generally used to calculate how long it will take for an asset to move from peak to peak or from trough to trough (or vice versa). The commodities channel index (CCI) is typically restricted to the range of +100 to -100; however, when it breaks out of that range, it signals the start of a significant new trend. Because of this, the main difference is that CCI is more concerned with the beginning or finish of a significant cycle than with the intervals between them.
Conclusion
The Detrended Price Oscillator evaluates long-term cycle lengths in asset prices that are invisible to the naked eye. Traders can use this price oscillator to enhance their trading strategies, anticipate possible reversals in price direction, and determine market cycles. However, it’s crucial to identify its limitations, such as its lagging nature. The DPO can help traders improve the efficacy of their trading methods and make better-informed judgments in the financial markets when combined with other technical analysis tools and a variety of market conditions are taken into account.


