

Nothing measures an asset’s overall momentum just like the CMO indicator or the Chande Momentum Oscillator does. It is a rare momentum indicator, developed and introduced by Tushar Chande in his book ‘The New Technical Trader’ in 1994.
What is Chande Momentum Oscillator
The CMO is the difference between the sum of recent up days and the sum of recent down days. The result is then divided by the sum of price absolute movements within the specified period. Lastly, it is multiplied by 100. Here, the given period is normally 20 periods.
When the CMO has applied on a chart, it creates a line that shows price momentum or movements up and down. There is also a zero line that plays a crucial role to understand the momentum indicator. CMO indicator value ranges between -100 and +100.
Below is the chart showing the CMO on a daily chart.

How Does the Chande Momentum Oscillator (CMO) Work?
There are multiple situations when the CMO works differently and requires different sets of strategies at the same time to give accurate results. Let’s have a look at some of them:
- Chande Momentum Oscillator shows two extreme conditions- (1) highlights overbought situation at +50 level and (2) oversold situation at -50 level. Also, traders have to keep an eye on the 20-period CMO line to see if it crosses the zero line from above or below, that too with respect to the 9-period moving average.
- CMO is also capable of calculating trend strength. It is directly proportional to the CMO absolute value i.e. the trend will improve as the CMO values rise.

-
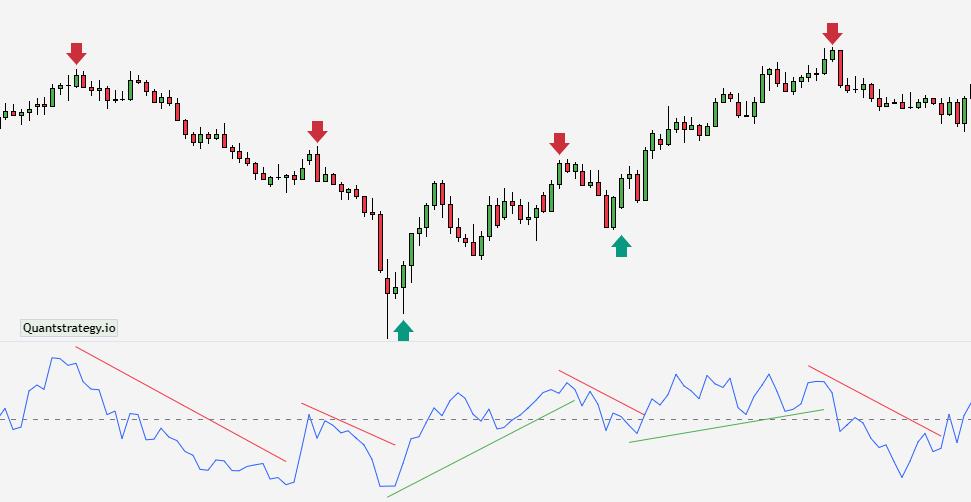
CMOs are also known for creating chart patterns- such as trend lines and double bottoms and tops- but, they don’t show up on the actual price chart. Though, traders still have to keep a close eye on the trends and figure out when the CMO shows support or resistance.
-
There would be divergence leading to a price reversal if the underlying prices show new lows or highs, which the CMO doesn’t support.

CMO Indicator Formula
CMO = 100 x [(Su – Sd) / (Su + Sd)]
Where:
Su = The difference between the recent close and previous close summed for up days over the specified period. Up days show the time when the recent close is better than the latter.
Sd = The difference between the recent close and previous close during down days within the same period, summed to get the absolute value. Down days refer to the time when the recent close falls below the previous close.
The trend is ignored when the previous close is equal to the current close.
How to Use CMO in Your Trading Strategies?
The Chande Momentum Oscillator (CMO) is a versatile indicator that can be used in a variety of ways to generate buy and sell signals.
To begin with, traders have to find out whether the chart is trending downwards or upwards. It’s an important step because it might not give satisfactory results if a security’s price ranges.
Afterward, traders have to choose the period they want to analyze. Keep in mind that here, the default time period is 20 days.
Though, many traders may have to invest some time in testing out various periods to figure out which one would work best for them. For some, a longer period may work while others may find a shorter period favorable.
Below is the chart showing 28-period and 9-period CMO applied on the EUR/USD chart.

Approaches of Using the CMO
Overbought and Oversold Levels
The first and foremost approach is to identify the overbought and oversold levels. An asset is overbought when the value of the Chande Momentum Oscillator measures over 50. A short trade would be an ideal decision here.
On the other hand, an oversold situation – lower than -50, shows a substantial fall in the asset’s price.

Here, it the worth mentioning fact is that even though the strategy stands effective in most of situations, it may even give wrong results. Some day traders prefer the Chande Momentum Oscillator at the overbought level or vice versa. The reason behind the strength of momentum at extreme levels.
The Zero Line
Another approach to generating buy and sell signals is to use the zero line crossovers. If an asset price increases and the Chande Momentum Oscillator line crosses the 0 line, it means momentum build-up. As the result, traders may decide either to continue holding or buy the asset.
Moreover, traders may take an exit from the trade if the CMO shows a reversal and passes from below the signal line.
On the contrary, if the CMO moves below the signal line as the result of a decrease in the asset price, traders have to sell off to earn good returns.
Below is the chart showing the bullish and bearish trends of the USD/TRY currency pair when the price fluctuates.

Signal Line and CMO Crossover
When combined with moving averages, the Chande Momentum Oscillator can be a good trading assistant.
To identify the crossover levels, it’s important to put the Exponential Moving Average (EMA) over the CMO. In a bearish crossover, the price usually drops and vice versa.

The Stochastic Oscillator Vs. the Chande Momentum Oscillator
As discussed before, the Chande Momentum Oscillator is responsible to evaluate relative strength through patterns. It works like Wilder’s RSI where, the relative is between lows and highs, referring to the long-term bearish divergence or bullish divergence.
In the Stochastic Oscillator, the technical momentum indicator is capable of generating rhythmic waves, moving between oversold and overbought extremes. It usually works on a second “zero/signal” line, where the high and low crossovers indicate trading opportunities.
Relative Strength Index Vs. Chande Momentum Oscillator
The RSI has many features similar to the CMO indicator- particulates their ability to provide overbought or oversold conditions.
Invented in 1978, the Relative Strength Index has been in use for several purposes. However, it still holds some uniqueness from the Chande Momentum Oscillator which traders have to know before placing to the RSI.
One of the major differences is the way how the momentum indicators work. The Relative Strength Index works on the speed of price movement while the Chande Momentum Oscillator works on the closing price for each trading day. Despite their different ways of calculations, both, surprisingly, give similar values in the end.
Limitations of Chande Momentum Oscillator
While CMO can be used to identify overbought and oversold conditions, it is not without its limitations. CMO is a lagging indicator, meaning that it will only provide signals after a trend has already begun. CMO is prone to false signals during periods of choppy market conditions. As a result, traders should use CMO in conjunction with other technical indicators to confirm trading signals.
Conclusion
The Chande Momentum Oscillator has emerged as one of the most reliable and effective tools for the trading market. Apart from being an easy-to-use technical analysis indicator, it is more reliable than other indicators in the market.


