In the world of financial markets and trading, where uncertainty and volatility reign, traders are always on the lookout for effective tools to aid their decision-making process.
One such tool that has gained popularity is the Choppiness Index. This indicator provides insights into market trends and helps traders make informed choices.
In this article, we will delve into what the Choppiness Index is, how it works, and how traders can leverage it to enhance their trading strategies.

Understanding the Choppiness Index (CI)
What is the Choppiness Index Indicator?
The Choppiness Index (CI) is a technical indicator that was developed by Australian commodity trader Bill Dreiss. It aims to quantify the trendiness or choppiness of a financial market which is called as Choppy market indicator.
In essence, the Choppiness Index Indicator helps traders and analysts assess whether a market is currently in a trending phase or a choppy phase (trading sideways).
The Choppiness Index is particularly valuable because it provides traders with a numerical value that quantifies the degree of market movement. This value can range from 0 to 100, with specific thresholds often used to classify the market’s trendiness.
Calculating the Choppiness Index
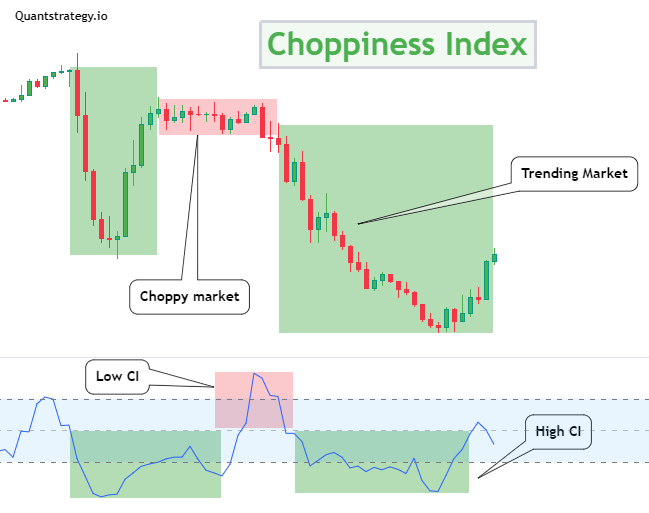
The Choppiness Index is calculated using a formula that takes into account the range between the highest high and the lowest low over a certain period. The result is then smoothed to provide a value between 0 and 100. A low CI value suggests a trending market, while a high CI value indicates a sideways movement or choppy market.
The Choppiness Index Formula
At the heart of the Choppiness Index is a simple yet powerful formula that quantifies market trends and choppiness. The formula takes into account the range between the highest high and the lowest low over a specified period and then applies smoothing to provide a value between 0 and 100.
The Choppiness Index (CI) formula can be expressed as follows:

Where:
- n represents the number of periods considered.
- TR stands for the “True Range,” which is the highest of the following three values:
- Current high minus current low
- The absolute value of the current high minus the previous close
- The absolute value of the current low minus the previous close
- HIGH refers to the highest high over the specified period.
- LOW refers to the lowest low over the specified period.
- log10 denotes the base-10 logarithm.
In this formula, the numerator sums up the True Range values for each period, while the denominator calculates the difference between the highest high and the lowest low over the same period. The result is a value that represents the degree of choppiness in the market.
Traders often use a specific period length, such as 14 days, for the calculations. This value can be adjusted based on the trader’s preference and the market’s behavior.
By plugging in the relevant values and applying the formula, traders can obtain the Choppiness Index value, which aids in determining whether the market is trending or ranging. This information serves as a valuable guide for making trading decisions that align with the prevailing market conditions.
How to Use the Choppiness Index in Trading

Identifying Trends vs. Ranges
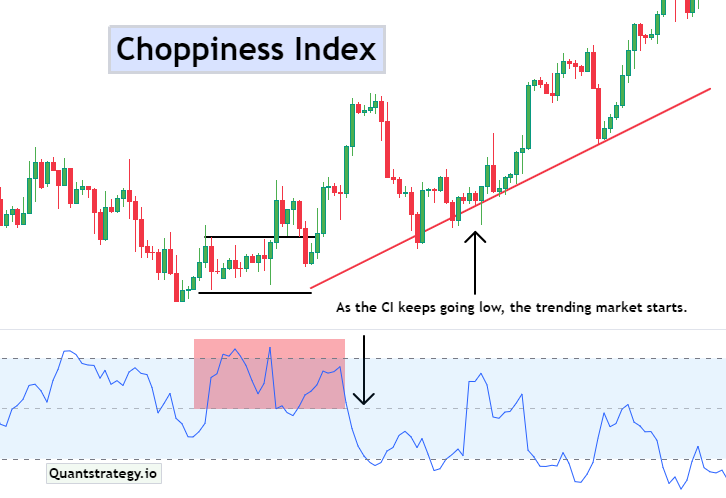
One of the primary uses of this volatility indicator is to identify whether a market is trending or ranging also identifying price direction. Traders can set thresholds to categorize market conditions. For instance, a CI value below 30 (lower threshold) might be considered a strong trendy market, while a value above 60 (upper threshold) could indicate a market is choppy.
The above red tight range rectangle shows the price action is too choppy and in sideways movement. The price breakout occurs as well as the CI declines below lower thresholds. This can be traded as potential breakouts.
Entry and Exit Points
The Choppiness Index can help traders pinpoint potential entry and exit points. In a trending market, traders might look for opportunities to enter during temporary pullbacks when the CI remains low. In a choppy market, where price movements are limited, traders could consider scalping strategies with quick buy and sell orders.
Setting Stop Loss and Take Profit Levels
For traders who employ trend-following strategies, the Choppiness Index can assist in setting appropriate stop-loss and take-profit levels. During strong trends, wider profit margins and relatively tighter stop losses might be suitable. In contrast, in choppy markets, conservative take-profit and stop-loss levels could be preferred.
Combining the CI with Other Indicators

To maximize the effectiveness of the Choppiness Index, traders often combine it with other technical indicators.
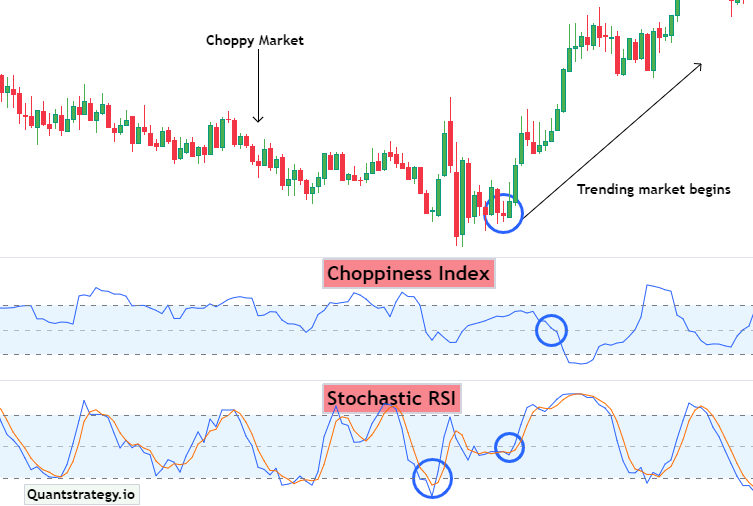
For instance, pairing the CI with moving averages or oscillators can provide a more comprehensive view of the market’s behavior. This combination helps filter out false signals and enhances the accuracy of trading decisions.
Common Scenarios in Choppiness Index Analysis
Scenario 1: Trend Continuation
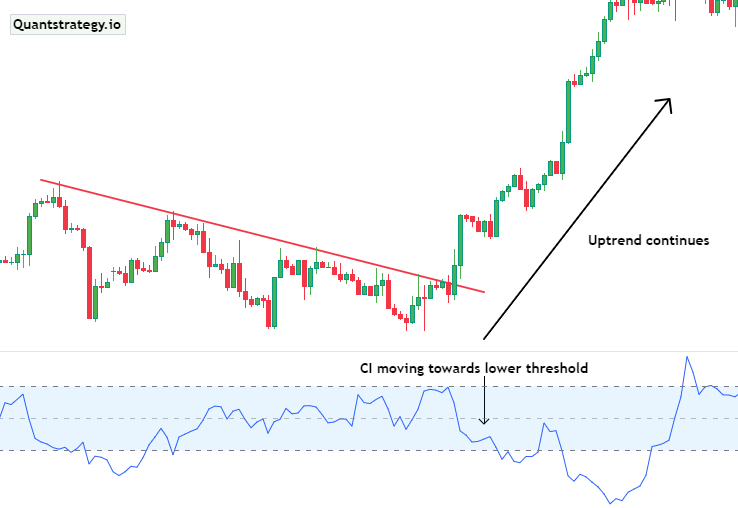
Suppose a trader identifies a strong uptrend in a certain asset. The Choppiness Index during this period remains consistently low, indicating a clear trend. As the CI hovers around the lower threshold, the trader can confidently hold their position, expecting the trend to continue.
Scenario 2: Ranging Market
In a ranging market, where price movements are confined within a range, the Choppiness Index tends to spike. A trader might observe the CI consistently surpassing the higher threshold. In this situation, it’s advisable to employ range-bound strategies such as channel trading or mean reversion.
Scenario 3: Transition Phase
Market conditions can transition from trending to ranging and vice versa. During these transitional phases, the Choppiness Index might oscillate around the threshold values. Traders need to exercise caution and consider additional indicators to confirm the direction of the market before executing trades.
Advantages and Limitations of the Choppiness Index
Advantages
- Simplicity: The Choppiness Index is easy to calculate and interpret, making it suitable for traders of all experience levels.
- Objective Assessment: It provides a quantitative measure of market conditions, reducing the influence of emotional decision-making.
- Versatility: The CI can be used across various timeframes, from short-term intraday trading to long-term investing.
Limitations
- Whipsawing: The Choppiness Index may generate false signals during periods of low volatility, leading to whipsaw trades.
- Market Transitions: It might not swiftly adapt to sudden market shifts from trending to ranging and vice versa.
- Supplementary Tool: While valuable, the CI is best used in conjunction with other indicators and analysis methods.
Putting Theory into Practice
To illustrate the application of the Choppiness Index, let’s consider a real-world example. Imagine a forex trader analyzing the EURUSD currency pair. After calculating the Choppiness Index and observing it hovering around the lower threshold, the trader identifies a clear uptrend. This insight encourages the trader to enter a long position, aiming to capitalize on the ongoing trend.

As the trader monitors the CI and its relation to the threshold values, they adjust their exit strategy. Upon detecting a significant rise in the CI, indicating potential trend exhaustion, the trader decides to exit the position, locking in profits before a potential reversal.
Conclusion
In the dynamic realm of trading, having a reliable tool to gauge market conditions is invaluable. The Choppiness Index offers traders a simple yet effective way to assess trends and ranges, aiding in more informed trading decisions.
By incorporating the insights gained from the Choppiness Index with other technical and fundamental analyses, traders can enhance their strategies and navigate the markets with greater confidence.
FAQs (Frequently Asked Questions)
What is the significance of the Choppiness Index in trading?
The Choppiness Index helps traders determine whether the market is trending or ranging, guiding their trading strategies accordingly.
Can the Choppiness Index be used for different trading styles?
Yes, the CI is versatile and can be applied to various trading styles, from day trading to long-term investing.
Is the Choppiness Index suitable for novice traders?
Absolutely. Its simplicity makes it accessible for traders of all levels, including beginners.
What are some common mistakes when using the Choppiness Index?
One common mistake is relying solely on the CI without considering other indicators or market factors


