
Relative strength index (RSI) and Moving Average Convergence Divergence (MACD) are two of the most popular indicators used in forex and cryptocurrency trades. Most traders only utilize one of these indicators and are unaware of how powerful they can be when used together. You must learn how to configure and combine them if you want to be a part of profitable trading.
Are you thinking why you should use them together?
Because one of them (the RSI indicator) provides a buy/sell signal, and the other (the MACD indicator) provides a buy/sell confirmation.
Although they represent the same approach for analyzing trades, MACD and RSI indicators serve distinct roles, making it advantageous to combine them in trade evaluation. Here’s an explanation of how to use MACD and RSI in your trading analysis.
What is MACD?
The MACD, or Moving Average Convergence Divergence is a momentum indicator that is mostly employed for trading trends. MACD shows the connection between two moving averages while examining their disparity.
The default settings are two exponential moving averages (EMAs) – a 12-period EMA and a 26-period EMA, which are also known as fast length and slow length, respectively. The 9-period EMA is the MACD or signal line, which is determined by deducting the 26-period EMA from the 12-period EMA.
Compared to the simple moving average, which determines the average price through time, the exponential moving average provides a greater weight to recent price data.
As mentioned above, the chart contains a signal line that exactly does what it states: it indicates trading entry points. Buy signals are generated when the MACD crosses above the signal line; sell signals are generated when it does the opposite. An illustration would be:
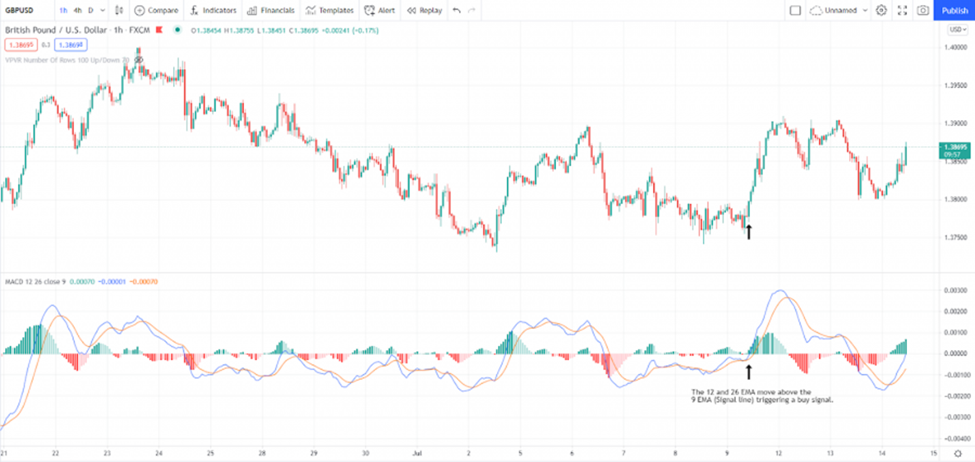
In the aforementioned example, the MACD crossing above the signal line (9-period EMA) signifies that the market is experiencing a bullish momentum and that the price is expected to rise further. Additionally, you’ll see that the faster moving average crosses the signal line before the slower moving average.
In contrast, when the price moves in the opposite direction, below the signal line, the slow length also crosses under the fast length, suggesting that the momentum might keep going lower, and now a trader would be in a good sell position. Thus, the MACD crossover is employed by many traders in their trading strategies.
When you initially open your chart, you can examine the MACD from an analytical standpoint to determine whether the present momentum is bearish or bullish and whether it appears that the trend will continue or reverse.
Key MACD Indicators to Monitor
When analyzing MACD to find trading opportunities, an elaborate analytical strategy can assist you in spotting particularly high momentum for large price swings that can swiftly produce profits—or losses, based on which side of the price swing you are making trades on.
The two important patterns that result from a MACD crossover are the ‘golden cross’ and the ‘death cross’. Making the most of MACD in your trading strategy requires recognizing these patterns, which are practically mirror opposites.
-
Golden Cross
It is a bullish indicator that often observes a positive crossover following a price dip marked by high volume selling. Following the selloff, the price starts to rise in value. At this point, the crossover occurs with strong upward momentum, pushing the price well over the crossover line and generating a sizable profit for traders who recognized the prior dip.
-
Death Cross
It is a bearish indicator, which is the opposite of the golden cross. As purchasers suck up the currency, prices rise, but once this demand is met, prices fall, creating a crossover with significant downward momentum.
What is RSI?
The Relative Strength Index, or RSI, is another momentum indicator, which examines the strengths and weaknesses of the trend of an asset to determine if it is overbought or oversold and identifies a possible trend reversal. It calculates the average price gains and losses through a particular time period (period setting).
The RSI indicator has a single line that swings between 0 and 100. The RSI is displayed as a line graph with two levels set at 70 and 30, as can be seen in the chart lower down this page. The price can fluctuate over and below these levels. The RSI’s standard number of periods is 14, however, this can be changed.
As you might have anticipated, if the RSI crosses above 70, the asset is considered overbought, and if it drops below 30, it means the asset is oversold.
An RSI value above 50 denotes the strength of the buyers prevail, so prices increase. On the contrary, values below 50 signify the dominancy of sellers and that the prices decline accordingly.
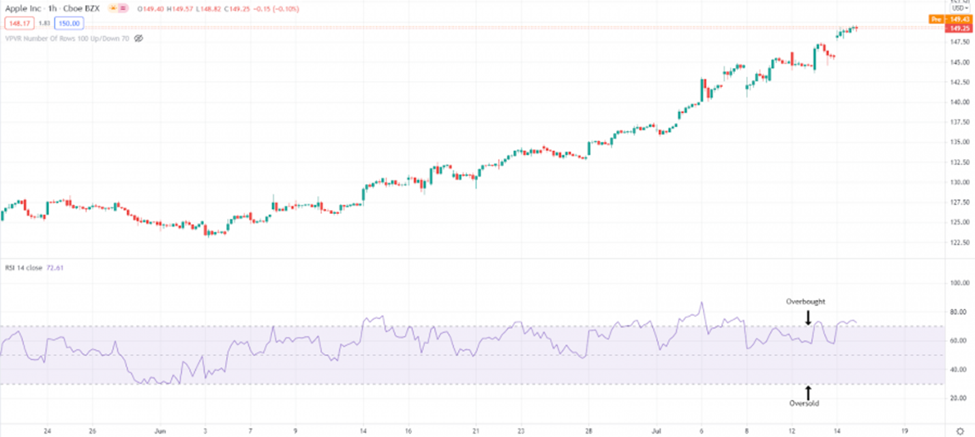
The above chart demonstrates that the RSI value for Apple’s current stock price is above 70, which indicates that it may be in the overbought zone at the current price.
The RSI can be used as a tool for trend analysis or as a signal for when to enter or exit a trade. As shown, the RSI value can, however, remain below 30 or above 70 for some time, which renders it crucial to know how to use the indicator correctly.
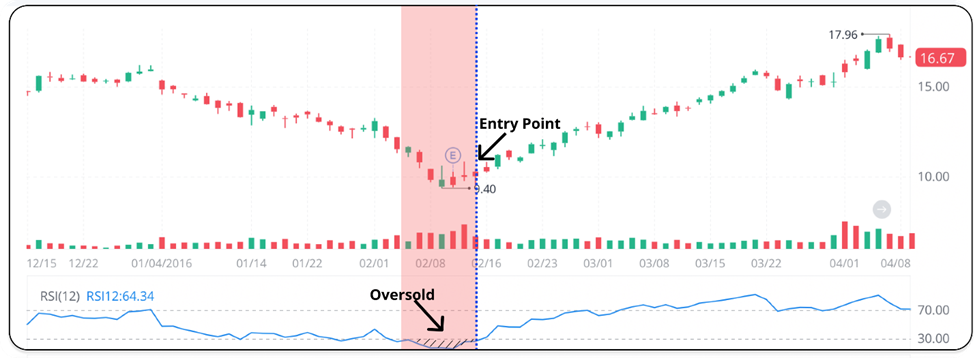
In the below example, the RSI declines below 30 following a protracted downward trend. It remains in the oversold zone for a few days, demonstrating a significant downward momentum. A possible rally may begin when the RSI rises back to 30. This may indicate a good buy signal for the stock because it typically signals the end of the oversold phase.
While 70% and 30% are the default values for the overbought and oversold levels, respectively, these can be changed. For instance, traders may see that an asset turns overbought at 60% rather than 70%, allowing them to modify their strategies accordingly.
Divergences and failure swings can be recognized as an RSI strategy in addition to overbought and oversold signals. Some even employ higher-period RSI to find the overall trend.
A reversal may also happen when the actual price diverges from the RSI signal. Divergence is a useful tool for people who want to spot the most recent trend reversals. When the indicator’s parameters are in a standard setting, up to 14 trading periods’ worth of data are plotted on the chart.
Like the MACD indicator, the RSI also determines the information based on the desired trading timeframe. For instance, a 14-day timeframe will be used if trading is performed using the daily chart. Similarly, when you trade based on the hourly chart, the data will be shown according to the 14-hour cycle. The RSI divergence period can, therefore, be set for a shorter time frame when the market is active.
The RSI findings are displayed by the latest price movements, which reduces false signals that become obvious in a shorter timeframe when the market is changing quickly.
Importance of Combining MACD and RSI Indicators
Some traders, particularly newcomers, believe that you must select between the MACD and RSI. These two indicators are unquestionably trustworthy and accurate. However, you must know that from a particular standpoint, neither of them can be superior to the other. We can also say that MACD and RSI complement one another.
While MACD and RSI can help identify a price reversal and trend momentum, they have their shortcomings.
- MACD typically sends indications late since it measures historical price changes.
- RSI may produce misleading trading signals when volume experiences sudden spikes and lags.
Swing traders can maximize the use of MACD and RSI by combining the two. The MACD and RSI confirmation of a bullish or bearish signal can be more accurate and consistent than simply one indicator of the two acting alone.
For this reason, it would be advisable to combine MACD and RSI to achieve better outcomes and increase your chances of success in your trade.
Therefore, once you are proficient in using the MACD indicator in technical analysis, consider learning to employ the Relative Strength Index to polish your technical analysis and improve your outcomes.
However, keep in mind that you may also combine the MACD indicator with other technical indicators. For example, the MACD and Stochastic indicator combination would be quite powerful. But the MACD and RSI combo is the one we most frequently see in the market.
MACD and RSI Strategy – How They Work Together
The RSI and MACD are frequently used in conjunction by traders and technical analysts to help them better comprehend the market. Both of these are momentum indicators, but because they evaluate different aspects, they can offer a more comprehensive picture.
They can also offer confluence and confirmation of a shifting trend when used in combination. Let us take a look at some of the trading strategies that employ both of them together.
MACD and RSI Strategy Setups
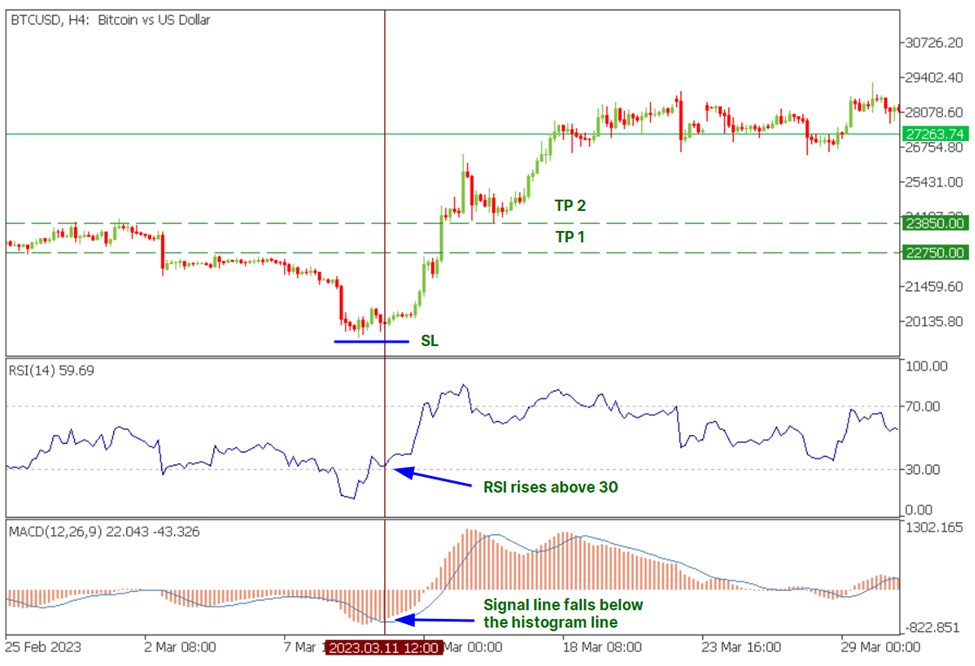
Guidelines for Long Entry
- Look for a time when the MACD signal line is above the MACD line and the RSI is below 30.
- Hold off until the MACD signal line drops below the MACD line and the RSI rises over 30.
- Place a buy order.
- Place your take-profit order at the resistance level or the moment a “sell signal” appears.
- Place your stop loss below the most recent low or by your risk-to-reward ratio (1:3 to 1:5 is advised).
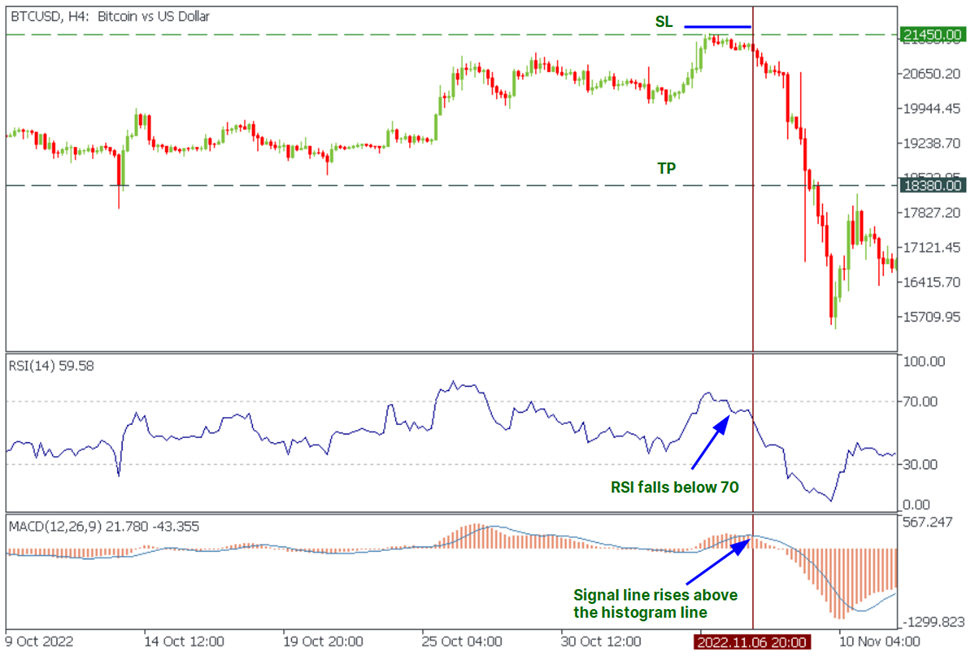
Guidelines for Short Entry
- Look for a time when the MACD signal line is under the MACD line and the RSI is over 70.
- Hold off until the MACD signal line moves above the MACD line and the RSI drops below 70.
- Place a sell order.
- Establish your take profit at the support level or the moment a “buy signal” appears.
- Set your stop loss at your risk-to-reward ratio (1:3 to 1:5 is suggested) or higher than the most recent high.
Important
Like any other method, combining MACD and RSI may not always produce the desired outcome. Yet, it is crucial to adhere to the regulations to increase profitability.
- Opening trades in the direction of the trend is advised. You need to establish the general direction and extend a longer timeframe to execute this.
- Setting stop loss and taking profit ratios greater than 1:2 is advised. The ideal proportion is between 1:3 and 1:5.
Proper Risk Management
Even though MACD and RSI are frequently paired because of their track record of success, it is still possible for both indicators to produce false signals even when used together. You should always use risk management practices as a trader to protect yourself from losses brought on by these false signals.
The signals that RSI and MACD provide may be more dependable and give you greater confidence when they are in harmony. However, they are not infallible, and placing too much faith in them might result in expensive losses.
Other Indicators Employed with MACD and RSI Indicators
Experienced traders are aware that the finest trading approaches use a combination of chart patterns and multiple indicators to confirm potential trades. Even while MACD and RSI might end up being the main indicators in your trade evaluation, you might also wish to use other indicators as part of your investigation.
Apart from the Stochastic indicator that we have already mentioned above, some other common technical indicators used with RSI and MACD are:
- Simple moving average (SMA): SMA can provide extra information about the likelihood that a price movement will reverse direction.
- Volume-weighted average price (VWAP): Based on volume and price movement, this calculation provides an additional method to support the information provided by MACD and RSI.
- Bollinger Bands: If you are expecting a price reversal, it is always important to check whether the price is headed towards one of these bands—particularly if you expect traders to open or close positions according to these levels.
Conclusion
Combining MACD and RSI indicators is the quickest and most straightforward method of trading with price momentum and trends. With technical analysis, employing multiple indicators at once can help decision-making. However, try to do your analysis based on your trading style and financial goals to avoid any unnecessary losses. Remember to first practice your trading strategy on paper before investing real money!