


The world of investing and trading can be overwhelming, so traders need dependable technical indicators to help make judgments. This is because you will utilize technical indicators to forecast the price action of the financial asset. The Aroon indicator, developed by Tushar Chande in 1995, is one commonly employed trend-following oscillator that measures the strength of a trend and whether price behavior favors a trend or sideways action.
The odd name for the oscillator, “Aroon,” was chosen in part due to Chande’s ancestry because it refers to “Dawn’s Early Light” in the Sanskrit language.
This article will explore the Aroon indicator in detail, outlining its characteristics, trading signals, and application in actual trading.
Aroon Indicator Explained
Aroon indicator is a technical indicator that belongs to the oscillator family of indicators and is used to determine the direction and strength of a trend in the price of an asset. The indicator essentially estimates the time between highs and lows over a period. Moreover, it can also be beneficial to recognize the end of a market that is consolidating and the start of a new trend.
The idea behind it is that strong uptrends and downtrends are supposed to regularly reach new highs and lows, respectively. Aroon indicator shows when something is taking place and when it isn’t.
The indicator was developed by a market-recognized technical analyst, Tushar Chande, in 1995 (as other tools such as CMO or Chande Momentum Oscillator). The word ‘Aroon’ means “Dawn’s Early Light” in Sanskrit dialect. So, as the name suggests, it reveals the early start of a new trend (early light).
The Aroon indicator has two lines of different colors.
These two lines are known as Aroon up and Aroon down. Below is a EURUSD chart that illustrates the Aroon indicator at the bottom. Aroon up line is depicted in this example in yellow by default, whereas Aroon down is in purple.
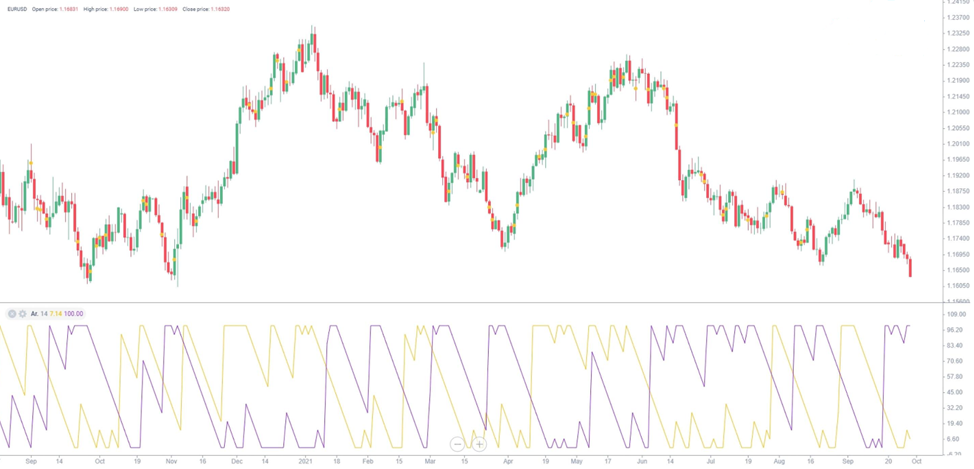
These lines fluctuate within a specific range, just like any oscillator. In the instance of Aroon, the indicator oscillates between 0 and 100.
Aroon up calculates the amount of time passed since the price reached its high over a specific time frame. The Aroon up value will be 100 if the high of the most recent bar was also the highest during the period under consideration. If not, it gives a percentage number representing the length of time since the period’s most recent high.
Aroon down estimates the amount of time passed since the price reached a low over a specific time frame. In contrast to Aroon up, the Aroon down value will be 100 if the low of the current bar is the lowest during the time under consideration.
In other words, Aroon up line estimates the strength of the uptrend, whereas Aroon down line estimates the strength of the downtrend.
The Aroon up and down lines are positioned on one another and exhibit movements between 0 and 100 values. The indicator is usually used for 25 periods. This displays the amount of time that has transpired since the price recorded a 25-day high or low.
Besides, the Aroon Oscillator is a technical indicator that employs the Aroon Up and Aroon Down components of the Aroon Indicator to assess the strength of an existing trend and the likelihood that it will persist.
How Aroon Indicator Works?
As we know, Aroon indicators have two lines – Aroon up and Aroon down. These lines can be plotted by employing the Aroon indicator formula. It may seem somewhat complicated at first glance, but it is a lot simpler in actuality.
Aroon Indicator Formula
Aroon up = [(25 – number of periods since 25 period high)/25] x 100
Aroon down = [(25 – number of periods since 25 period low)/25] x 100
The Aroon calculation demands keeping track of high and low prices, usually over 25 periods. You should follow the following steps to make calculations in the above formula.
- Keep tabs on a stock’s highs and lows throughout the previous 25 periods.
- Record the duration of time since the previous high and low.
- Use the Up and Down Aroon formulae to enter these numbers.
Now you know how the Aroon indicator functions, you can infer that it will display a value of 100 whenever the most recent high of the current trading day is formed. A continuous new uptrend will have an Aroon up value of 100 and an Aroon down value of 0, respectively.
Aroon Oscillator Explained
There is a modified version of the Aroon Indicator in addition to the original one created by Tushar Chande. It can be calculated by subtracting the readings of the Aroon down indicator from the Aroon up indicator.
It is shown as a single line that balances between -100 and 100. The Aroon Oscillator often employs the same techniques for spotting trends. If it travels toward its upper boundary, it indicates an uptrend, and if it moves toward its lower border, it indicates a downtrend.
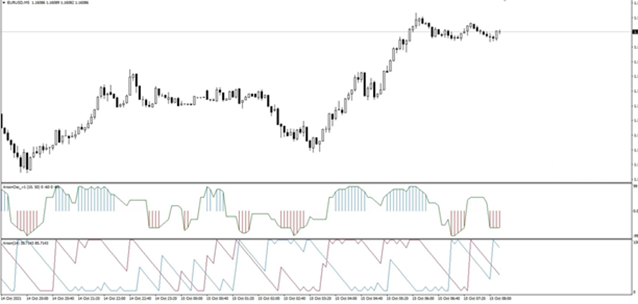
The classic indicator is shown at the bottom, and the oscillator is shown above the indicator window of the Aroon chart above.
The oscillator transmits signals that are straightforward and clear. To identify probable trend changes, traders look for zero-line Aroon crossovers. It is a buy indication when the oscillator line crosses over from the negative zone into the positive one and a sell signal when it crosses over from the positive zone into the negative one. Aroon indicator values between 40 and 100 suggest a bullish trend; readings between -40 and -100 show a definite bearish trend.
How to Read Aroon Indicator?
Let’s talk about the Aroon trading signals, which may be used to trade the Forex market as well as stocks, crypto, binary options, and other financial instruments. Using the Aroon indicator is based on the interpretation of many signals.
Determining the trend direction
The position of the lines about one another at a level close to 30% and 70% defines the trend. Aroon up line increases over 70% and occasionally even 100% during an uptrend. Aroon down line, accordingly, declines below 30%, sometimes reaches 0% in a downward trend.
Let’s look at the samples below to understand how the Aroon signals function.
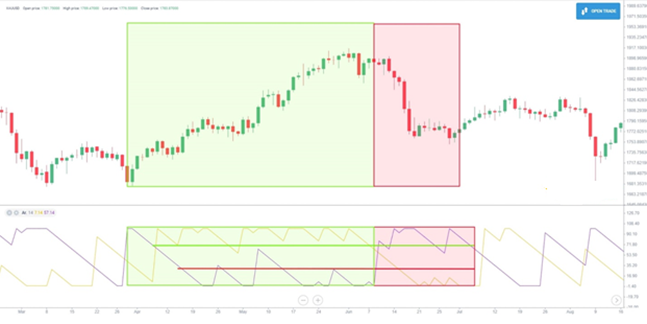
On the XAUUSD price chart, the green zone denotes an uptrend, and the red zone denotes the ensuing bearish correction. Keep in mind that during the bullish price behavior, the yellow line is 70% above the green horizontal line. The purple line is 30% below the red horizontal line mostly.
Line Crossovers
The crossovers of lines are the Aroon main signal.
A buy signal is generated when the Aroon up line crosses the descending Aroon down indicator from the bottom up and rises over the zone of 30%. At this point, a new uptrend typically begins, providing a favorable entry point for a long position.
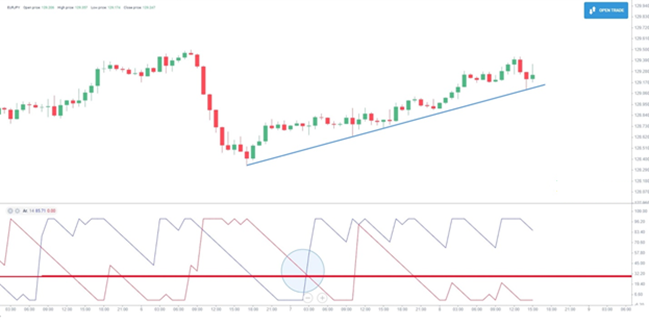
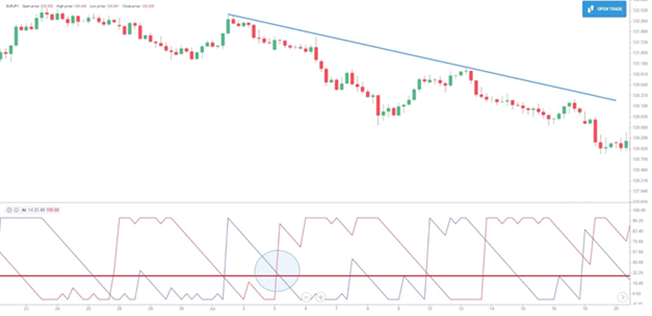
The red horizontal line indicates a level of 30% in the EURJPY chart. Besides, the blue circle denotes the point when Aroon up crosses the Aroon down line from below to the top. As you know, the next Aroon crossover happens right after the indicator line crosses the 30% zone at the start of the bullish trend.
This trade signal can be used to compute the expiration time for binary options as well as to enter long trades. If there is still a significant amount of time before the contract expiration, for instance, this signal in reasonably long timeframes will be a reliable indication that the price will move up for a sizable amount of time.
When the Aroon down remains outside of the 30% zone and its line crosses the descending Aroon up from the bottom up, an Aroon sell signal is generated.
A strong sell signal is displayed by the Aroon indicator above. The green line indicates a 70% level. The blue circle indicates that location when the red Aroon down line crosses the blue Aroon up line upside. This indication denotes the beginning of a new downward trend in the market.
Trend Stages
The readings of Aroon indicators offer surprisingly precise information on price highs and lows, the intensity of the current trend, and the stage of the trend development. If Aroon’s line is
- Greater than 70%, indicates a strong trend (bullish).
- 50-70%, it indicates a growing bullish trend.
- 30-50%, it indicates an exhausting trend.
- Lower than 30%, signals that purchasers are no longer motivated to drive up the price.
If Aroon down line is
- Greater than 70% indicates that a bearish sentiment is dominating the market.
- 30-50% indicates that the bearish trend is exhausting, but buyers have not yet seized the lead.
- 50-70%, it indicates that the bearish trend is intensifying
- Below 30%, the downtrend is gone.
Parallel moving Lines
Traders typically do not view parallel-moving Aroon lines as an entry indication. Parallel movement of the indicator lines generally denotes price consolidation, which frequently precedes a price breakout.
Frequent Crossovers
A balance between supply and demand is indicated by frequent crossovers, which typically manifests as a trading flat or sideways trend.
Aroon Indicator Trading Strategies
Two main trading strategies can be implemented using the Aroon indicator. Let us explore them one by one.
Breakout Trading Strategy
This Aroon indicator trading strategy is predicated on identifying the consolidation and watching for a range’s border crossover.
The trading strategy includes the following steps:
- Find a consolidation, such as the parallel movement of both Aroon up and down lines indicating price consolidation, which is inevitably preceded by a new price breakout.
- Watch for a breakout signal (a crossover of lines followed by a crossing of the 50-line) on the Aroon indicator system.
- Anticipate a breakout of the consolidation border to prevent false signals.
- Place a trade in the direction of a breakout. Don’t forget to set a stop-loss order close to significant support and resistance lines.
- Exit a trade as it reaches the following significant level.
This can be explained through a relevant example.
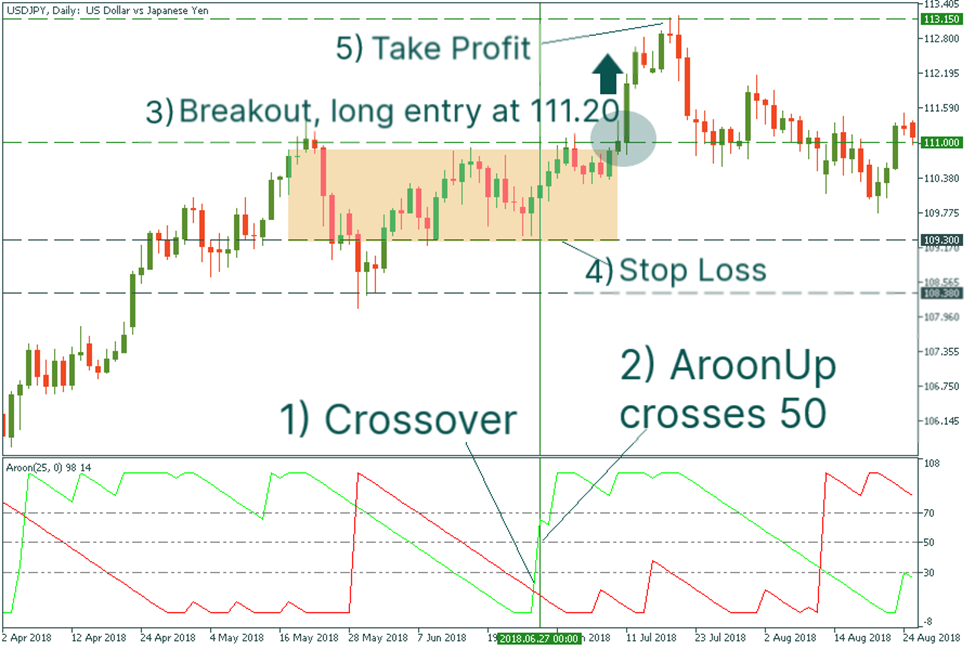
The price on the USDJPY daily chart consolidated between 109.3 and 111.00. This verifies the consolidation. The Aroon indicator lines were lower than 30. We wait for more signals to enter a long trade after the Aroon crosses the Aroon down to the upside. These indications were due to a strong break of the upper boundary of the consolidation at 111.00 and the 50-line by Aroon up. We set the entry point and stop loss at 111.20 and 109.30, respectively. The Take Profit was set at the prior significant resistance level of 113.15.
Trend Strength Trading Strategy
The second Aroon indicator trading strategy has to do with adhering to solid trends. As was said in the previous sections, an uptrend is deemed strong when Aroon up is at its maximum point (around 100), and Aroon down descends below 50. Aroon down should be close to 100 and Aroon up should be under 50 during a downtrend.
You must carry out the following steps for a long entry.
- Watch for Aroon down to drop below 50 and Aroon up to pass the 70 line.
- After the cross, place a long entry on the subsequent candlestick.
- Set a stop loss order at the prior important support level.
- When the opposite crossover of the Aroon lines, or the reversal signal, appears, manually close your order.
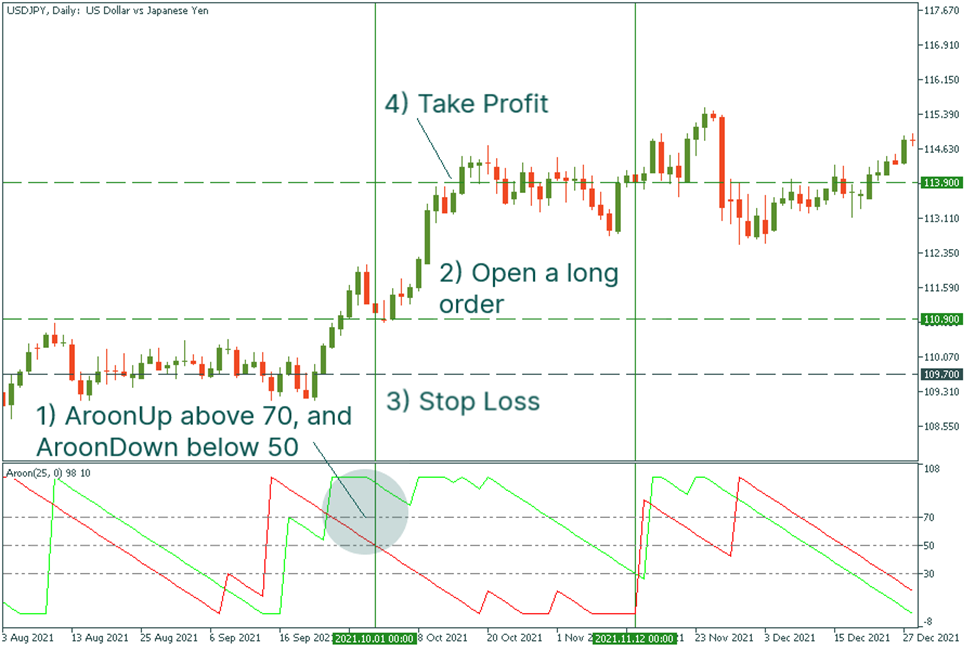
Take a look at the illustration. We waited for AroonUp to surpass the 70-line on the USDJPY daily chart and AroonDown to drop below 50. We entered a long position at 110.90, and set our stop loss at 109.70. When AroonUp declined below 30, we closed the position at 113.90.
You should use the following algorithm for your short entry:
- Check for a crossover first. Aroon down must pass the 70 level. Aroon up must drop below 50.
- Position the stop loss a distance above the entry point or close to the nearest resistance.
- Exit your position whenever Aroon down crosses below the 30 line.
Advantages & Disadvantages
Much like other indicators used in technical analysis, the Aroon indicators have advantages as well as drawbacks.
Some of the benefits include accuracy with which trends are defined, efficiency, and outstanding and obvious indications of a trend’s reversal.
Lags, false signals during sideways markets, and the requirement for signal confirmation by other technical indicators are the key drawbacks.
Conclusion
The Aroon indicator is a helpful technical indicator in forex trading as well as in trading stocks or cryptocurrencies. When you know how the indicator functions and how to read it, you can recognize trend reversals and profit from them.
Additionally, when combined with other indicators like the MACD or moving average indicator, you get a better idea of market patterns and can decide whether to enter or exit the market.
You can decide which Aroon indicator strategy would be advantageous for you by understanding the indicator’s purpose and how it operates.


