
Traders must know what they are looking for when examining a price chart; otherwise, they’ll just be staring at candlesticks. They are searching for patterns, which could signal a trend breakout, continuation, reversal, or something else, as spotting these early can result in big profits. The diamond chart pattern is one pattern that is thought to be uncommon yet capable of producing excellent returns when discovered.
The diamond pattern takes its name from its close resemblance to a diamond shape. It is a rare chart pattern fairly unknown among investors and technical traders. Many of them aren’t very familiar with its formation or trading application.
In this post, we will learn the diamond chart pattern in detail and how to build a trading strategy on it.
What are Diamond Patterns?
A diamond pattern is a chart pattern that is commonly used to identify trend reversals. The pattern occurs when the price begins to flatten following a steady downtrend or uptrend, leaving a diamond-shaped formation on the chart.
These diamond reversal patterns can take months or even years to complete, but when properly examined, the trend reversals they predict can be abrupt and take place more quickly than the pattern itself. This implies that if a trader finds a powerful diamond pattern and understands how to use it, they can expect to make some profitable trades.

Diamond Patterns are reliable reversal indicators that indicate the end of a bearish or bullish trend. They most frequently happen at major tops and with high volumes and rarely occur at market bottoms.
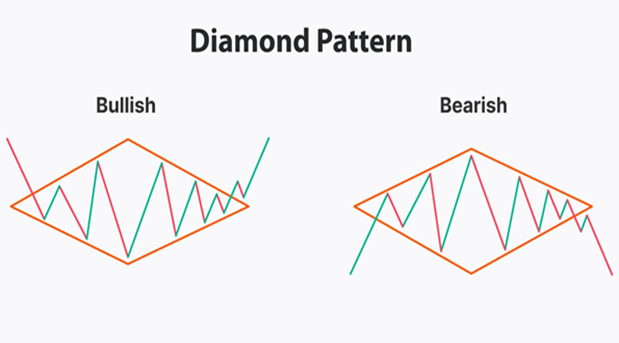
This results in the formation of the bullish diamond pattern and the bearish diamond pattern – two separate diamond chart patterns. Traders see the diamond tops and diamond bottoms as possible trading opportunities. Each pattern thus represents a potential opportunity to purchase or sell a market.
The diamond chart pattern itself is quite similar to a head and shoulders chart pattern but with a v-shaped neckline.
As mentioned above, it takes a while to form. It should first create two support and two resistance lines, diverge between highs and lows (broadening triangle), and then converge (symmetrical triangle) once more into a single structure. Moreover, there must be a minimum of two touches on each of the trend lines for the diamond formation to be considered complete. The outcome is a diamond shape. That is how the name came to be.
The chart below displays the diamond-shaped GBPUSD chart pattern as of June 7, 2019.
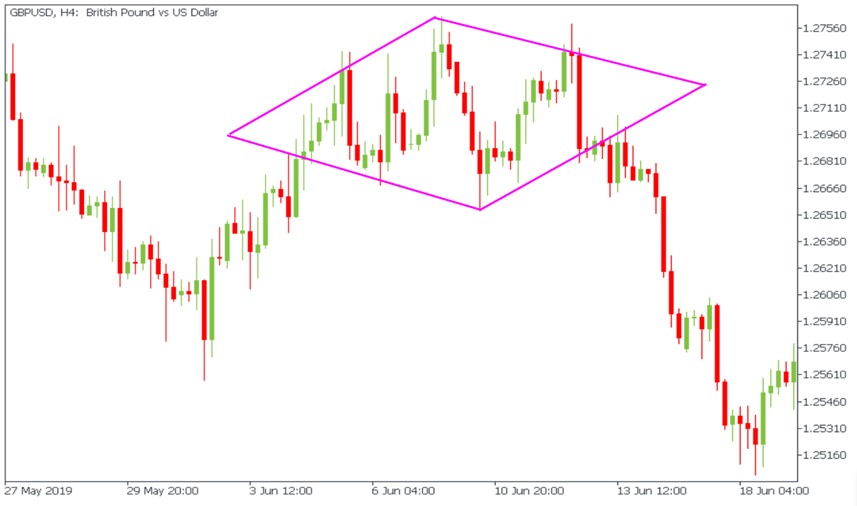
Unlike in the illustrations, the patterns, in reality, are not as even and well-defined. However, if the pattern follows the logic of both highs and lows and is roughly rhombic in shape, it is a diamond.
Types of Diamond Chart Patterns
Like most patterns that can be either bullish or bearish, the diamond pattern also has two types, with both requiring familiarization before using it in diamond trading. They are diamond top pattern and diamond bottom pattern.
The diamond top pattern or bearish diamond pattern usually forms during an uptrend and indicates a possible reversal to a downtrend. Conversely, the diamond bottom pattern or bullish diamond pattern forms during a downtrend and indicates a possible reversal to an uptrend.
Diamond tops depict nearly 80 percent of the cases and signal a price decline, while diamond bottoms depict only 20 percent of cases but signal a sudden increase in price once the pattern ends.
Like many trading patterns, diamond chart formation is tough to spot before it materializes. Chartism does, however, possess some powers of self-realization because it is widely used by the trading community. Today, it is vital to consider the appearance of a figure like a diamond in trading.
Most diamond chart reversals appear at significant highs and with high volume, uncommonly during market lows. You can see diamond lows with an upside breakout in a bull market, however in a bear market, they always perform second overall.
How to Trade the Diamond Chart Pattern
One should take into account several things when analyzing the diamond pattern trading strategy, such as the degree of volatility visible within the diamond shape, whether one is trading a bearish or bullish diamond pattern, and stop loss orders.
The diamond chart formation can be employed in several trading strategies. Here are a few typical approaches that traders can use.
Breakout Trading
Trading breakouts is one of the simplest strategies. To enter the market in the breakout direction, traders must wait for the price to break above the upper trend line in a diamond bottom formation or below the lower trend line in a diamond top formation. Keep in mind this must be after the diamond formation has had a minimum of two touches on each of the trendlines, else it isn’t a diamond chart pattern. Traders typically set stop loss order beneath the lower line in a bullish diamond pattern or above the upper line in a bearish diamond pattern or weigh the risk-reward ratio. A trader might take into account a trailing stop-loss option. If they are trading in a strong trend, it is possible to trace a take-profit target along with the stop-loss level.
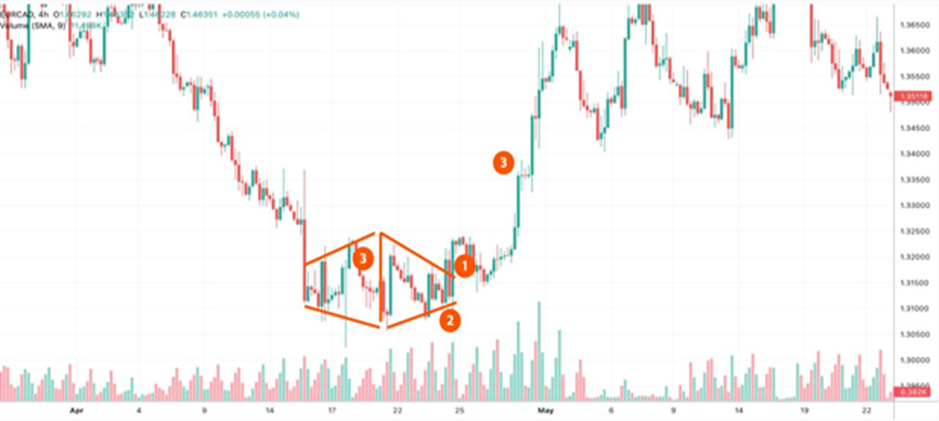
The price created a bullish diamond following a prolonged downtrend in the chart above. The price broke above the upper line (1). It couldn’t stay there, though, and eventually went back to the previous pattern. A trader might have anticipated another attempt by the bulls given the large increase in breakout volumes. The price return would not have influenced the trade if a trader had set a stop-loss level below the lower line (2). Price continued to rise after breaking through the upper line once more. A trader may have calculated the distance between the highest and lowest values and added it to the breakout point (3). A trader may have trailed that take-profit target because the bullish trend was robust.
Retracement & Reversal Trading
Another strategy is to watch for price retracements following the breakout. Traders might wait for the price to retest the broken trend line following the breakout and then enter a trade in that direction. In addition, a profit target will be determined using the distance between the high and low points and added to the breakout point. A stop-loss order will be set below the retracement level, depending on the risk/reward ratio. Traders frequently utilize limit orders in this strategy. You may also use this strategy with trailing take-profit and stop-loss orders.
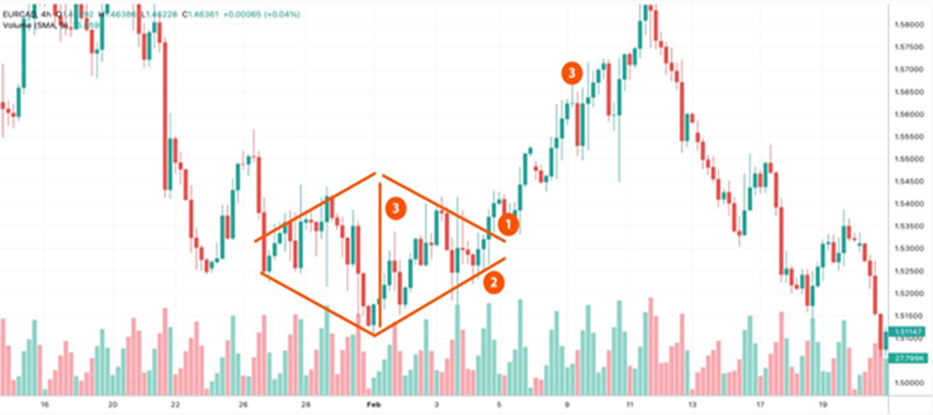
The price created a diamond bottom pattern on the aforementioned chart. It broke over the upper line of the pattern, however, it retested the pattern afterward (1). A trader may have used the upper line to place a buy limit order. A take-profit objective could have been set at the distance between the formation’s highest and lowest points (3), and a stop-loss could have been set below the lower line (2).
This method has the potential to be successful in identifying possible trend reversals through improved entry points and an enhanced risk-reward ratio. However, there is a chance of losing trade because the price can continue to move in the breakout direction without retracing.
Diamond Pattern vs. Head and Shoulders Pattern
Diamond formations are frequently compared with head and shoulder patterns because they have similar shapes. However, they boast specific differences that can tell which formation you are dealing with.
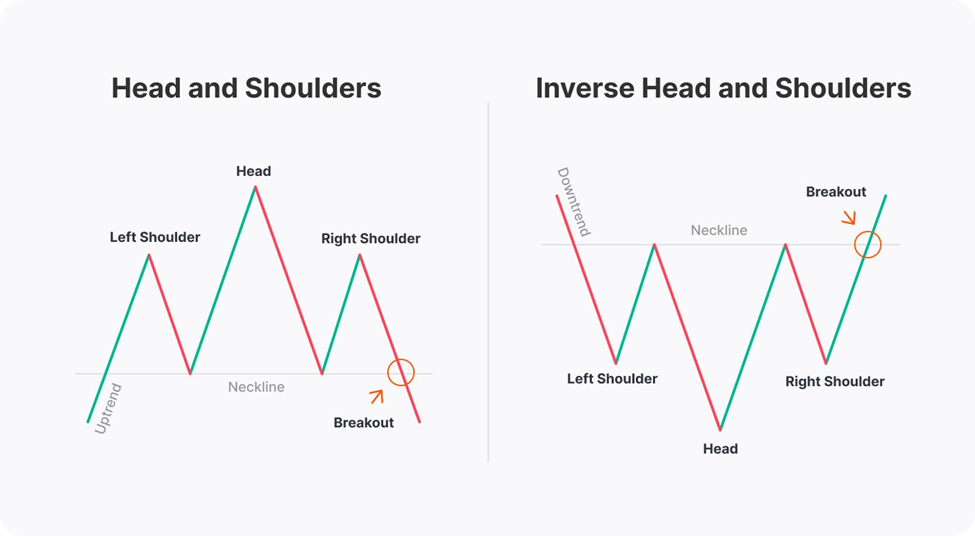
- The head and shoulders formation is a three-peak structure that develops at the end of an uptrend and has the central peak (the head) higher than the other two peaks (the shoulders). The inverted head and shoulders pattern, which appears near the end of a downtrend, consists of three troughs, the middle of which is lower (the head) than the other two. On the contrary, the diamond formation is characterized by a sequence of lower lows and higher highs that turn into higher lows and lower highs.
- The lows of a head and shoulders pattern are present on the same line known as the neckline. A trader can enter a trade if the price breaks the neckline, indicating a trend reversal. Regarding the diamond chart pattern, it is impossible to draw a neckline through the pattern’s lows or highs because they do not belong to the same line.
Pros and Cons of Diamond Chart Pattern
Like all patterns, diamond patterns also come with advantages and disadvantages. The following are some key pros and cons of a diamond formation.
Pros
- The diamond appears on timeframes of any length
- Works effectively with reversal trading strategies
- Offers sell and buy market entries
Cons
- Can generate false signals
- Occurs rarely
- Less efficacy on shorter timeframes
So, even if you believe you have spotted diamonds in your price charts, wait before making a choice. Use additional technical analysis tools to ensure that the reversal is imminent, and only then decide if you want to take action.
Conclusion
A diamond pattern is observed in all financial markets, such as stocks, forex, cryptocurrency, futures, and commodities. This technical analysis pattern occurs less frequently compared to other classic chart patterns. You must comprehend and recognize the pattern, though, as it can present a fantastic trading opportunity when it develops.
A diamond top formation, which arises following a rise in market prices, usually offers a larger possibility of trade than a diamond bottom chart pattern, which occurs after a drop in market prices. You should perform your testing to observe if this trend matches the markets you’re trading.