

When it comes to technical analysis, chart patterns play a crucial role in identifying potential trading opportunities. One such pattern is the rectangle chart pattern, which is formed when the price consolidates within a range with well-defined support and resistance levels.
In this blog, we’ll discuss what the rectangle chart pattern is and how traders can use it to make profitable trades.
What is a Rectangle Chart Pattern?
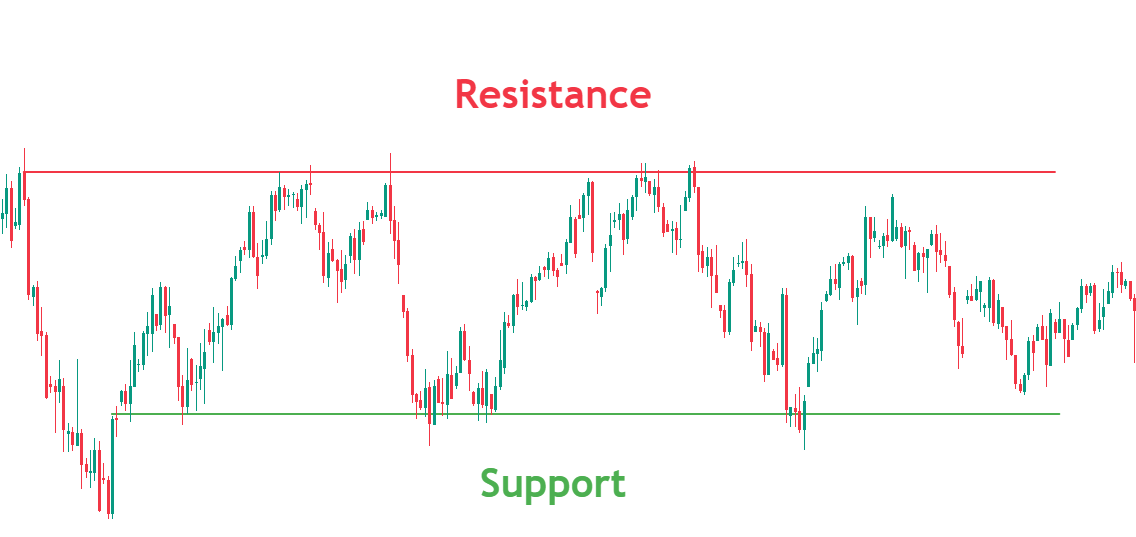
A rectangle chart pattern is a technical analysis pattern that is formed when an asset’s price moves sideways within a range with two horizontal trend lines acting as support and resistance levels. These levels are drawn by connecting the asset’s highs and lows. As the name suggests, the rectangle chart pattern is characterized by a rectangular shape.
Traders can use the rectangle chart pattern to identify potential breakouts in the price of an asset. When the asset’s price breaks out of the rectangle pattern, it is seen as a signal to enter a trade. Traders look for a significant increase in volume when the breakout occurs, which can confirm the strength of the move.
How to identify the rectangles chart pattern
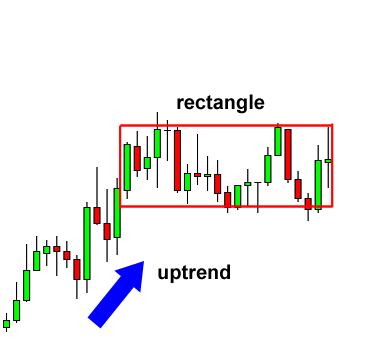
Bullish Rectangle pattern
A bullish rectangle pattern is a bullish continuation pattern that forms when the price of an asset trades within a horizontal range for an extended period. The pattern is formed by two parallel trendlines, with the support line acting as the bottom of the rectangle and the resistance line as the top of the rectangle.
The price here is in Uptrend, and the price consolidates in a rectangle pattern. The Price finally breaks out of the resistance level and continues the Uptrend.
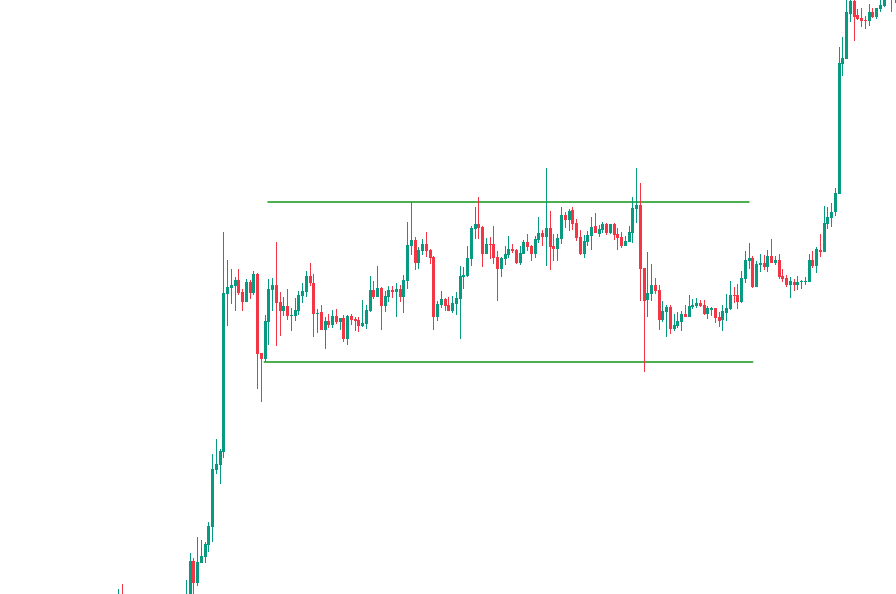
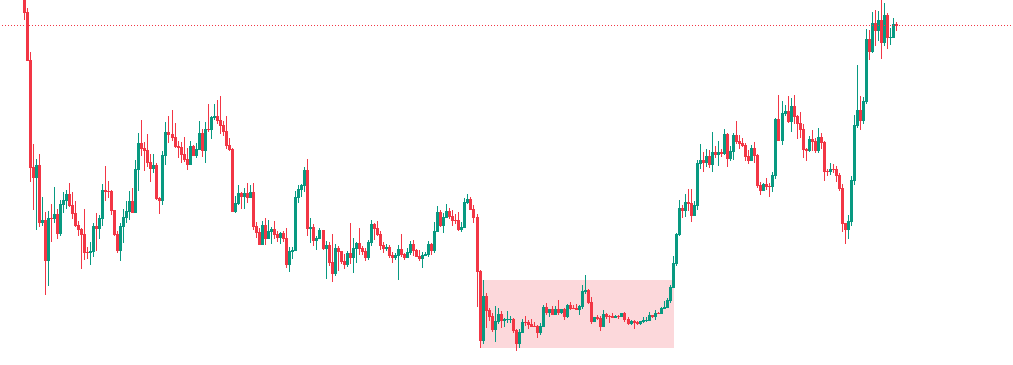
Bearish Rectangle pattern
The pattern is characterized by a flat bottom, which acts as support, and a flat top, which acts as resistance. The price moves back and forth between these two levels, creating a trading range. Traders often look for a break below the support level as a signal to enter a short position, as this indicates that the bearish trend is likely to continue.
The price finally breakouts the rectangles support level and go way down at least the size as it was trading before in the rectangles.
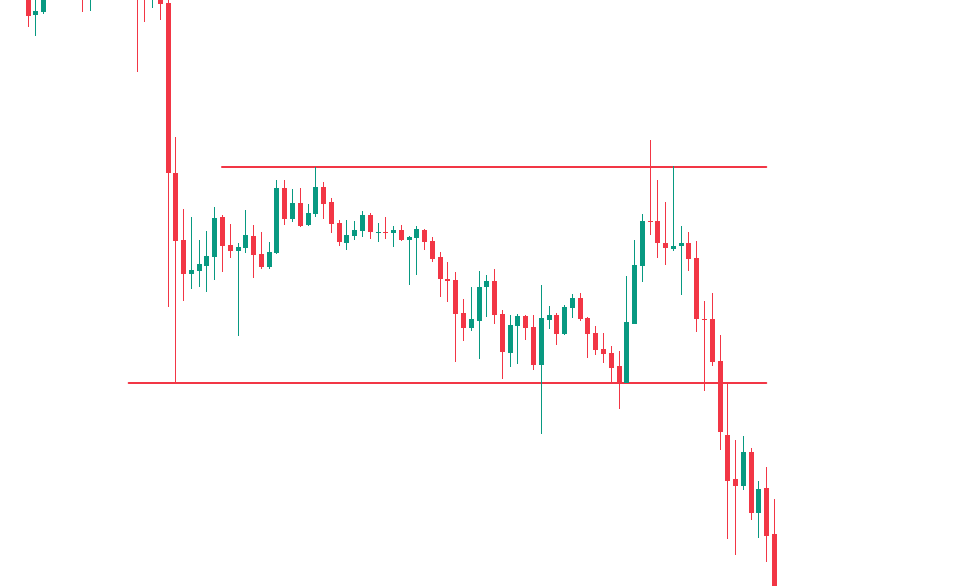
Reversal Rectangle patterns
Rectangle patterns can also be used as Reversals. Here the downtrend results in a rectangular pattern, where the price consolidates for a long time. Testing the rectangle’s upper parallel line and consolidating again in the pattern and finally managing to breakout direction resulting in an Uptrend.
How to Use Rectangle Patterns to Trade Breakouts
Step 1 – Identify the Rectangle patterns
Step 2- Mark the Support and resistance level
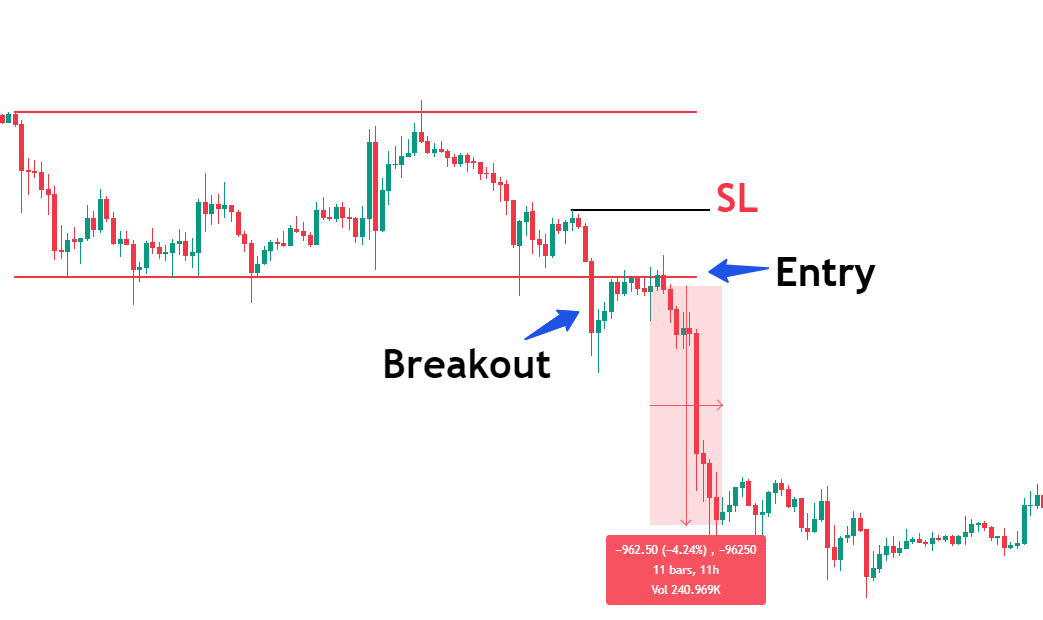
Step 3- Wait for the price to break out rectangle pattern, for eg. if the price breaks out below the rectangle’s support line, wait for the price to retest the pattern.
Step 4- Take the trade according to your stop loss, considering risk management.
Place your take profit anywhere around 1:2 or 1:3 risk-to-reward ratio. In the same way, you can take trades in a bullish rectangle pattern.
How to identify the bullish rectangles chart pattern
To identify a bullish rectangle chart pattern formed, traders look for the following:
- A clearly defined uptrend leading up to the pattern.
- Two parallel lines create a rectangular shape.
- The price moves back and forth between the two key price levels, creating a trading range.
- A break above the resistance level, indicates that the bullish trend is likely to continue
How to identify the bearish rectangles chart pattern
To identify a bearish rectangle chart pattern formed, traders look for the following:
- A clearly defined downtrend leading up to the pattern.
- Two parallel lines create a rectangular shape.
- The price moves back and forth between the two key price levels, creating a trading range.
- A break below the support level, indicates that the bearish trend is likely to continue
Conclusion
Rectangle patterns are a common technical analysis pattern that traders can use to identify potential trading opportunities. They indicate a period of consolidation in the market, with neither buyers nor sellers gaining the upper hand.
Traders can use breakout trading, range trading, or wait-and-see trading to profit from these patterns, depending on their risk tolerance and trading style. As with any trading strategy, it’s important to manage risk and use appropriate risk management tools like stop-loss orders.


