

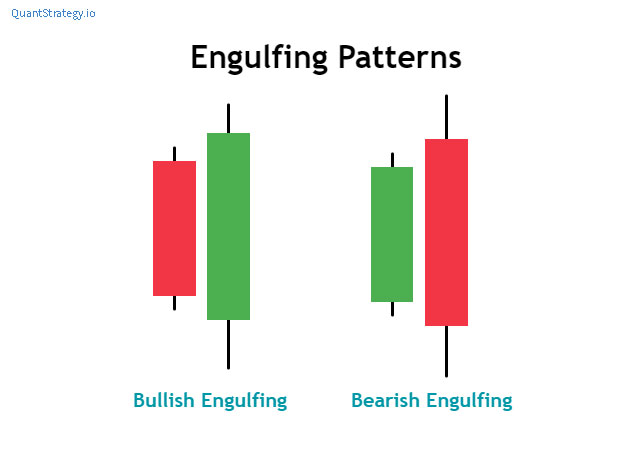
The bullish and bearish engulfing patterns are powerful and multiple candlestick patterns that indicate a reversal of a continuing trend in the market. They are popular candlestick patterns as they are easy to trade and spot.
The candlestick pattern involves two candles where the latter candle ‘engulfs’ the complete body of the previous candle.
The engulfing candlesticks can be bearish or bullish based on where they form concerning the continuing trend.
When combined with the price trending direction, which precedes them, their indication of the reversal creates opportunities for trading strategies.
What is Bullish Engulfing Pattern?
The bullish engulfing candles indicate a reversal of a downtrend and signal an increase in buying pressure. Usually, this candle is observed at the bottom of a downtrend.
The bullish engulfing reverses the continuing trend as a greater number of buyers enter the market and push the prices higher.
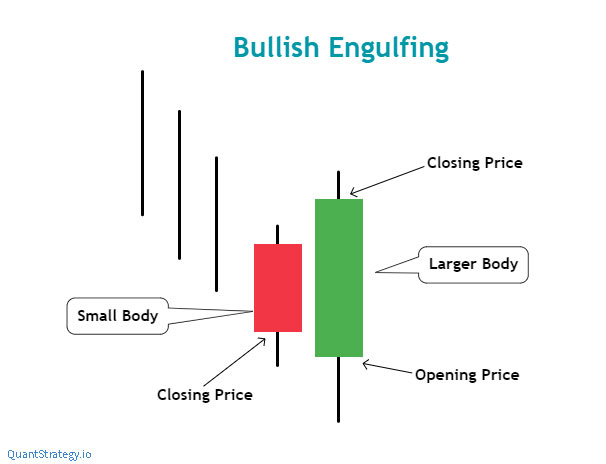
The pattern is a two-candle formation where candle A (the first candle)is always bearish, must be a lower candle, and is red on the majority of charting packages (or black in case of white/black color range). The red candlestick can be small or large as the thing important to the pattern is the size of the other candle.
Candle B (the second candle) is the bullish candle that completely engulfs the body of the first red candle. This point technically means that the second candle’s opening price should be lower than the first candle’s closing price. But for crypto markets, there’s no closing or opening of a trading time. A trader can transfer coins 24/7.
As a result, candle B has to simply overtake and engulf candle A.
What is Bearish Engulfing Pattern?
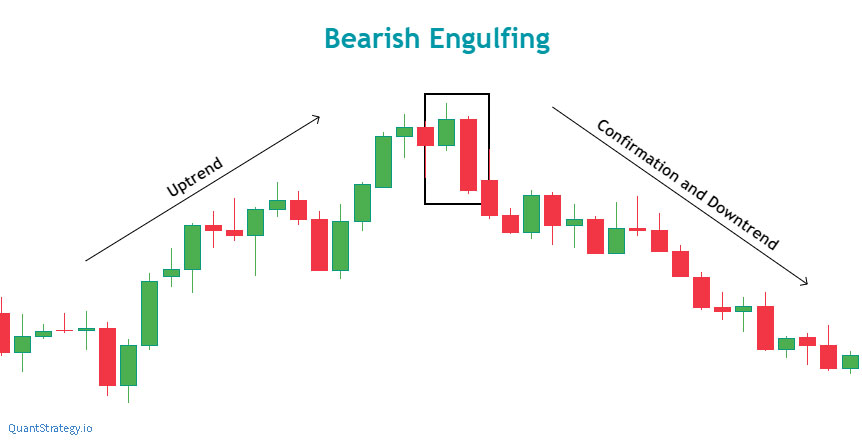
The bearish engulfing candlestick patterns are opposite to bullish engulfing candlesticks. They are formed in an uptrend and are bearish reversal patterns that signal a decline in prices by the seller, who applies the selling pressure when it occurs at the top of an uptrend.
The pattern triggers a reversal of continuing trend as a greater number of sellers enter the market, resulting in a decline in the prices.
The bearish engulfing patterns entail two candles where the bearish candlestick (red) completely engulfs the bullish candlestick (green). Besides, if the second candle is long and big, it can practically shut the door for the trader to open a trade because their stop will be positioned much away from the entry price, meaning greater risk and not a big reward.
How to Trade Bullish Engulfing Patterns?
Some important points should be kept in mind while trading with a bullish engulfing candlestick pattern.
- Prior trend – It is noteworthy that the previous trend is a downtrend.
- Pattern – The second candlestick must be bullish and engulfs the body of the prior candle.
- Stop loss – The stop loss can be set where the bullish engulfing candlestick pattern forms.
- Trade confirmation – Always confirm the signals generated by this pattern with other technical indicators, techniques, and key levels of support and resistance that will support or invalidate a trade.
Below is an AUD/USD daily chart, where the price movement had been put in a series of lower lows and lower highs to ultimately make three swing lows. The price movement suddenly strikes higher to create a powerful bullish candle following a new brief low.
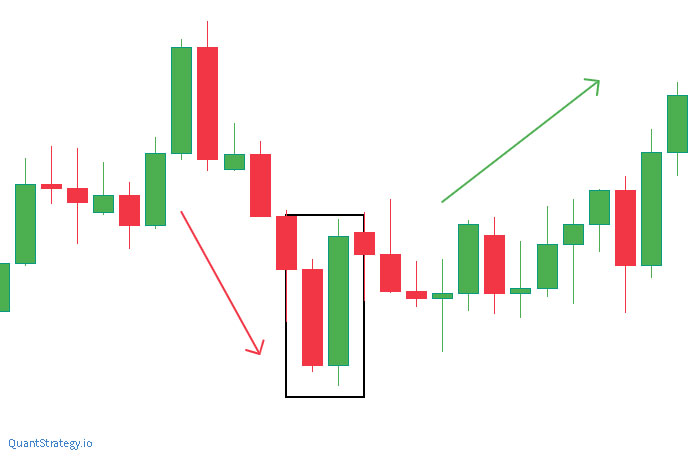
It is seen that all the components are in order, and the bullish engulfing candle is formed. Traders recognize this candlestick pattern and use this chance to capitalize on the impending shift in the trend direction. Besides, the price movement then pushes further higher to note two swing highs and end up trading at higher levels.
In the chart above, we observe the strength of bullish engulfing patterns. The trend reversal after the second candle indicated that bulls have total control of the price movement, and the downtrend may have finished.
How to Trade Bearish Engulfing Pattern?
Traders must always consider the following when trading with bearish engulfing candlestick patterns.
- Prior trend – It is noteworthy that the previous trend is an uptrend.
- Pattern – The second candlestick must be bearish and engulfs the body of the prior candle.
- Stop loss – The stop loss can be set below at the high where the bullish engulfing candle stick pattern forms.
- Trade confirmation – Always confirm the signals generated by this pattern with other technical indicators, techniques, and key levels of support and resistance that will support or invalidate a trade.
Investors can use two approaches to strengthen the bearish bias advised by the bearish engulfing candlestick.
Trading with Indicators
The EUR/USD daily chart below demonstrates a bearish engulfing pattern at the top of an uptrend. While it isn’t preferred to trade against a trend, reversals do take place, which is why every trader should spot when this is likely to happen.
The chart illustrates Euro topping out and appreciating the point where the bearish engulfing pattern occurs. The black circle (RSI) depicts the bearish bias with an overbought indicator.
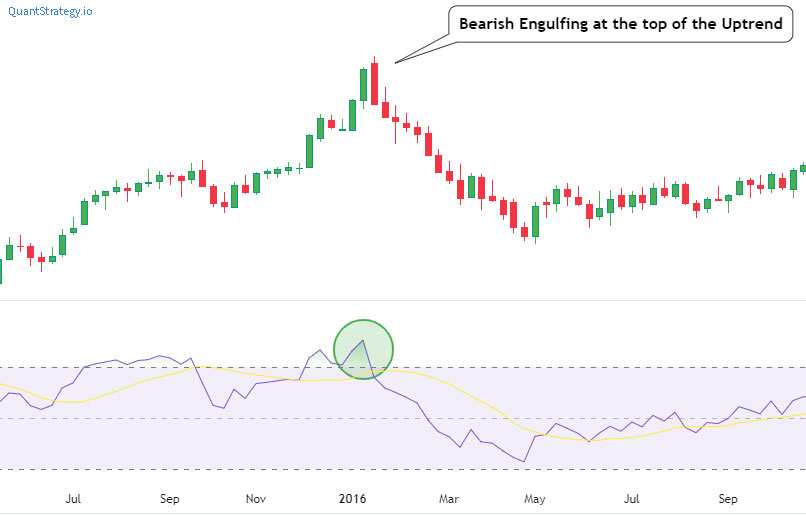
A closer look at the chart reveals entry levels, targets, and stops.
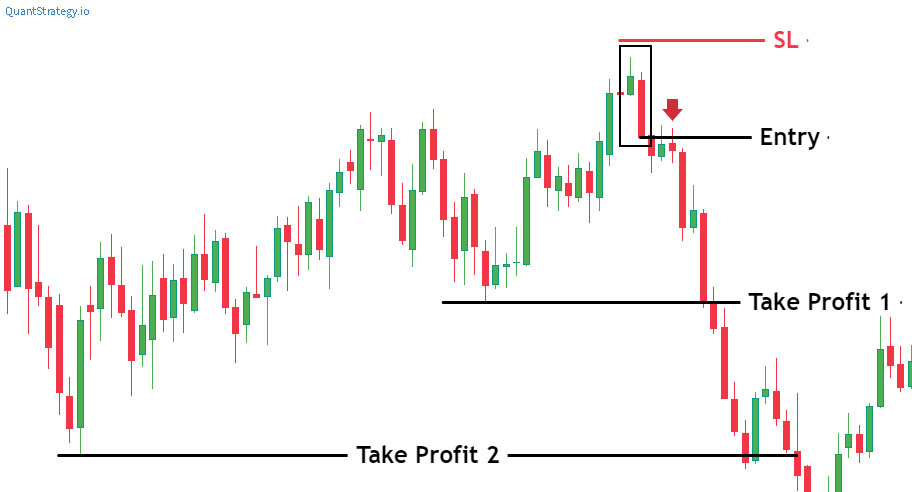
- Entry point
A trader can wait for a close below the low of the bearish candlestick or just set a working order way below the low.
- Stop Loss
The stop loss can be set above the new swing high because this can disprove the move and offers a practical risk/reward ratio.
- Take profit/ Target
As bearish engulfing candles can signal the outset of a lengthened downtrend, it’s useful to consider a basic take profit while staying open to further downward action. You may consider deploying a trailing stop or adjusting stops accordingly.
Trading with Support and Resistance
The below chart demonstrates a bearish candlestick pattern emerging at resistance on USD Index. The level of support has significance here as it depicts that higher movements were rejected earlier. When a bearish candlestick shows up at resistance, it offers greater surety toward a bearish bias.
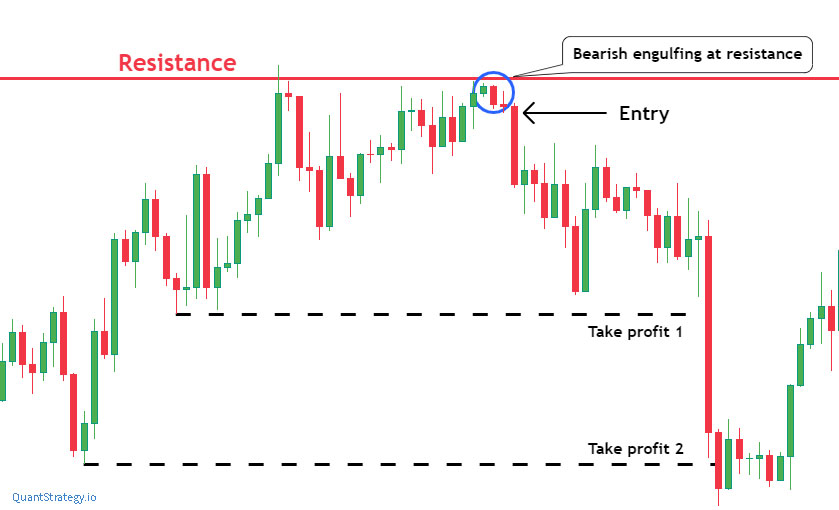
- Entry point
Investors may consider entering the trade at the opening of the latter candle as the bearish engulfing pattern is supported by the level of resistance.
- Stop Loss
The stop loss can be set above the bearish engulfing candlestick and the level of resistance. An action above this may disprove the action.
- Take Profit/ Target
The target can be placed at the new level of support. Similar to the above example, investors can consider the second target level or apply a trailing stop as the bearing engulfing candle can indicate the beginning of a constant downtrend.
Conclusion
Summing up, bullish and bearish candlesticks are a popular choice among traders. It must be emphasized that bearish engulfing refers to a bearish reversal pattern that develops during an upward trend in the price, whereas bullish engulfing is a bullish reversal pattern that warns traders about the increasing bullish movement at the low of a downtrend.
In order to trade bullish and bearish engulfing candlesticks with profits, the reversal must be confirmed by utilizing technical indicators and levels of support and resistance.


