

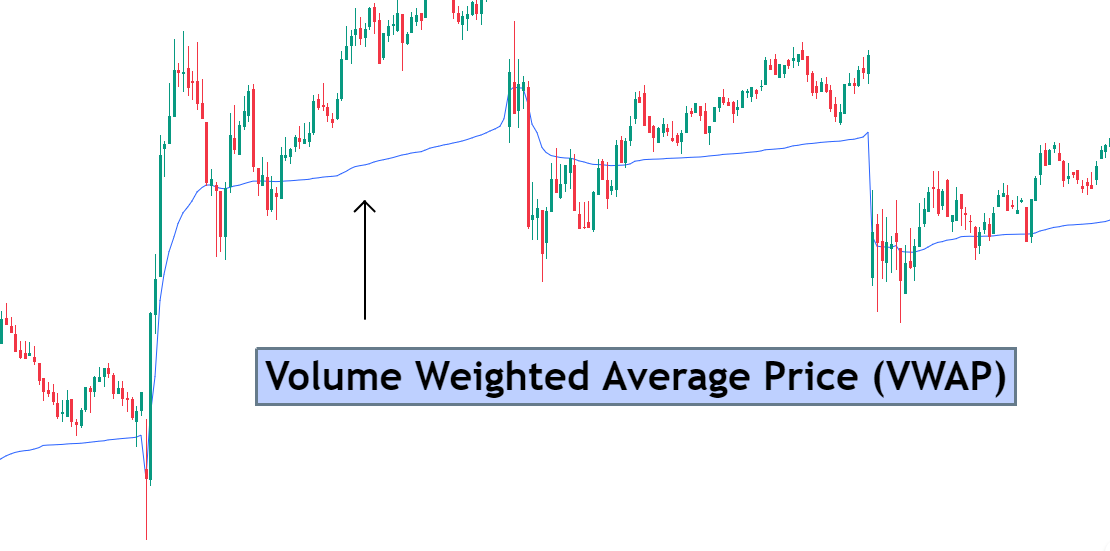
Volume Weighted Average Price (VWAP) is a technical analysis tool used by traders and investors to determine the average price of a security based on its trading volume.
The VWAP is used to identify the average price at which a security is traded throughout the day, taking into account the volume of trades at each price level.
In this blog post, we will discuss what VWAP is, and how it can be used in trading strategies.
What is VWAP?
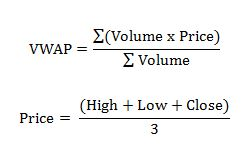
The Volume Weighted Average Price (VWAP) is a technical indicator that calculates the average price of a security based on its volume. The VWAP is calculated by dividing the total value traded by the total price volume traded over a specific period, usually one day.
It is used to identify the average price at which a security is traded throughout the day, taking into account the volume of trades at each price level. This can help day traders and investors identify whether a security is overvalued or undervalued levels in a trending market, and can help them make informed trading decisions.
Hence, market makers employ VWAP to pinpoint advantageous entry and exit positions. On the other hand, a skilled trader will attempt to sell at the VWAP or above when they need to liquidate a sizable position.
VWAP Calculation
The VWAP is calculated by dividing the total value traded by the volume over a specific period, usually one day. To calculate the VWAP, you first need to determine the total value and volume for each price level.
For example, let’s say that a stock is trading at three different prices during the day: $10, $12, and $14. The total value traded for each price level is as follows:
- $10: 100 shares traded, for a total value of $1,000
- $12: 200 shares traded, for a total value of $2,400
- $14: 50 shares traded, for a total value of $700
The total volume traded for each price level is as follows:
- $10: 100 shares traded
- $12: 200 shares traded
- $14: 50 shares traded
To calculate the VWAP, you would add up these total values for all price levels. You would then divide the total value by the total volume to get the VWAP.
Using the example above, the calculation would be as follows:
- ($1,000 + $2,400 + $700) / (100 + 200 + 50) = $11.71
The VWAP for the day would be $11.71.
VWAP Trading Strategy in Detail
The VWAP trading strategy is based on the VWAP line, which is a line that represents the average price of a stock weighted by its volume over a specified period of time, typically one trading day. The VWAP is a popular indicator used by traders to identify the trend of the market.
The VWAP trading strategy involves the following steps:
Calculate the VWAP : To calculate the VWAP , traders need to sum up the product of the price of each trade and the volume of that trade and then divide it by the total trading volume for the day. This calculation is usually done automatically by trading platforms.
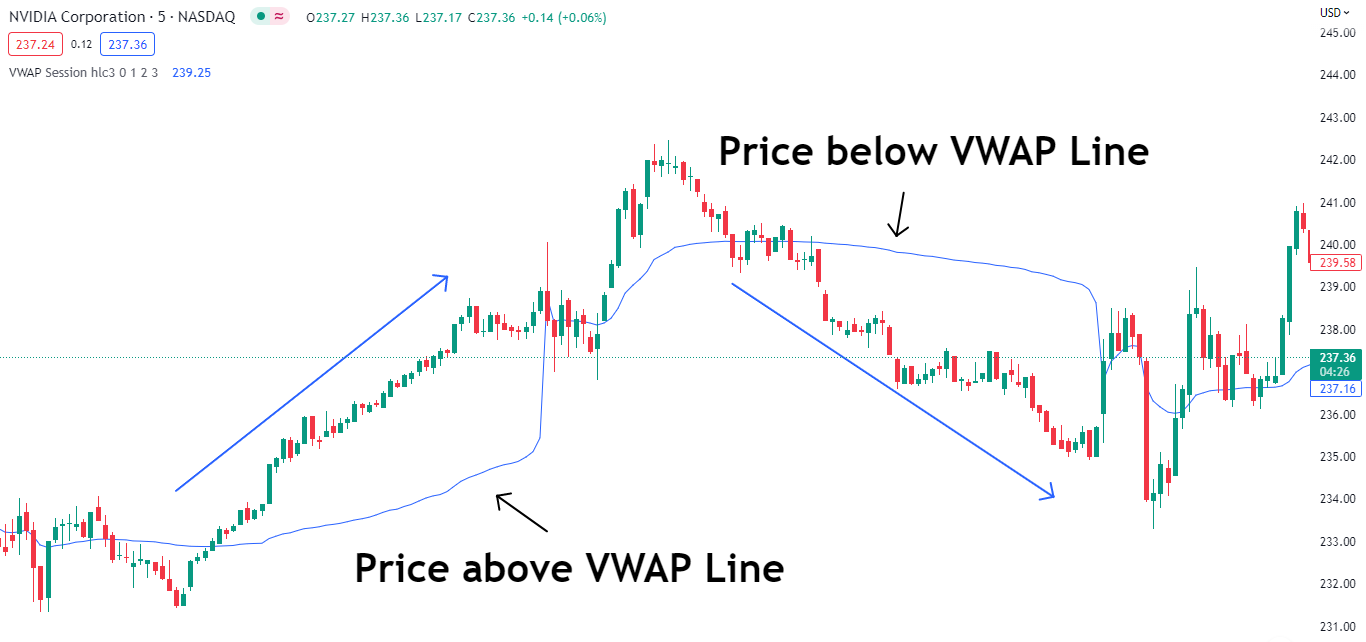
Determine the trend: Traders need to determine the trend of the market based on the position of the current price of the stock relative to the VWAP line. If the current price is above the VWAP line, it is considered an uptrend, and if it is below the VWAP line, it is considered a downtrend in a particular time frame.
Identify entry points: Traders can enter long positions when the price of the stock crosses above the VWAP Indicator on the price chart , indicating a bullish trend. Conversely, traders can enter short positions when the price of the stock crosses below the VWAP line on the price chart, indicating a bearish trend.
Here, we enter a long trade as candle gives a bullish close above the VWAP Indicator . Where our Take Profit target will be Swing High.
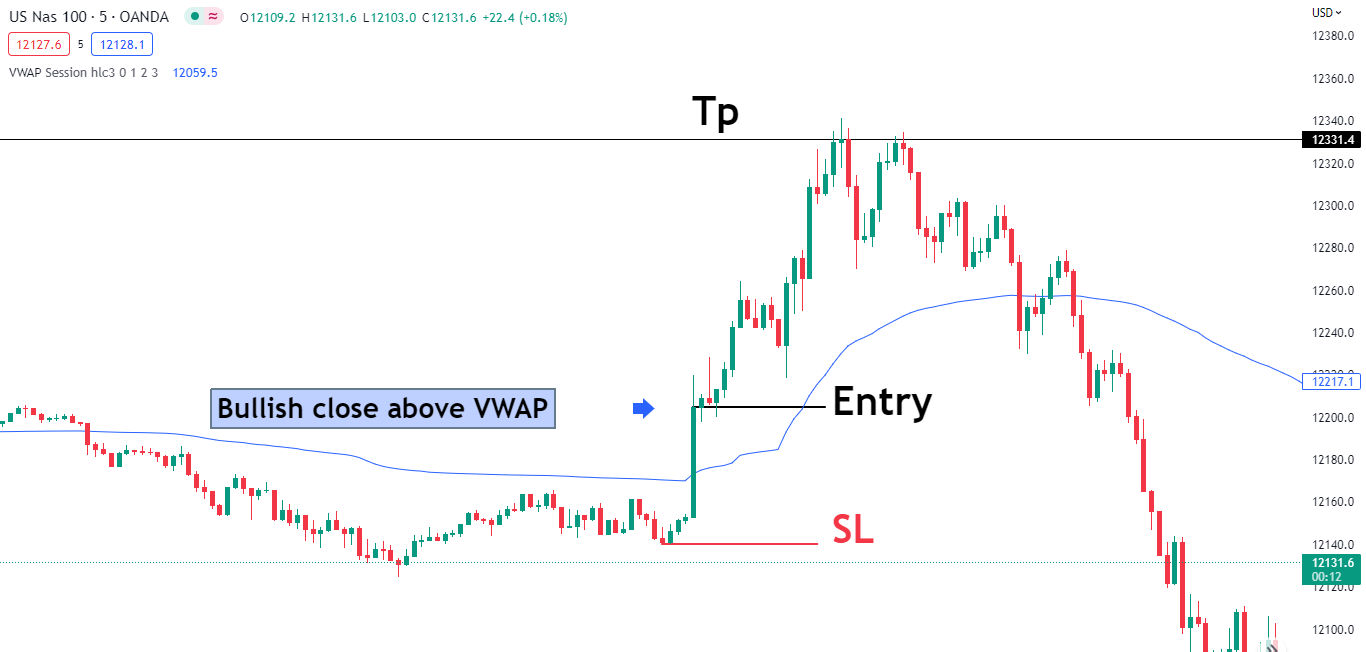
Manage risk: Traders need to manage their risk by setting stop-loss orders to limit their losses in case the trade goes against them.
Exit the trade: Traders can exit the trade when the price of the stock reaches a predetermined profit target or when the price crosses back over the VWAP line, indicating a reversal in the trend.
The VWAP trading strategy is popular among institutional traders and is often used for large orders that cannot be executed in one transaction. The strategy helps traders to minimize the impact of their trades on the market by spreading them out over time, thus reducing the risk of market manipulation.
How to Use VWAP to Spot Upcoming Market Trend
Identify the trend: The position of the price relative to the VWAP line can help identify the trend of the market. If the price is above the VWAP line, it indicates an uptrend, and if it is below the VWAP line, it indicates a downtrend. Traders can also use the slope of the VWAP line to identify the strength of the trend. A steeper slope indicates a stronger trend.
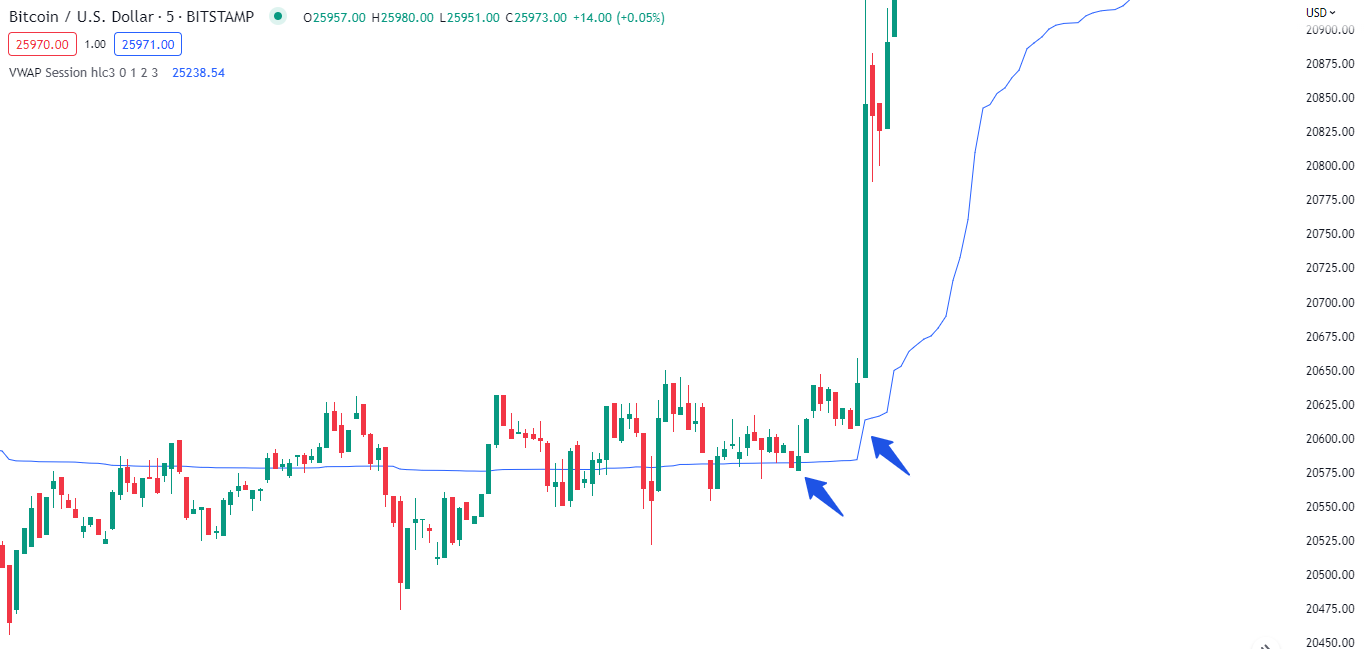
Look for breakouts: Traders can use the VWAP to identify potential breakouts. A breakout occurs when the price of the stock breaks through the VWAP line in either direction. A breakout to the upside indicates a potential bullish trend, while a breakout to the downside indicates a potential bearish trend.
Here, we can see the price moving sideways and then the price breaks above the VWAP line and retests the line and take a bullish movement resulting in a strong uptrend.
Combine with other indicators: Traders can combine the VWAP with other technical indicators, such as moving averages, to confirm the trend. If the VWAP is above the moving average, it indicates a bullish trend, while if it is below the moving average, it indicates a bearish trend.
Manage risk: Traders need to manage their risk by setting stop-loss orders to limit their losses in case the trade goes against them.
By following these steps, traders can use the VWAP indicator to spot upcoming market trends and make informed trading decisions. However, it is important to note that the VWAP should be used in conjunction with other technical indicators and fundamental analysis to make well-informed trading decisions.
Used as Support and Resistance
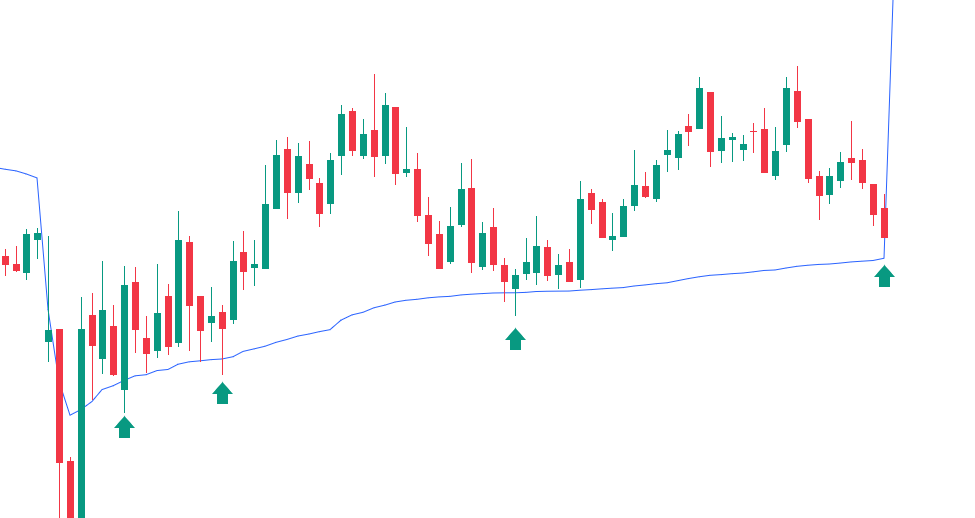
Support: Most of the times VWAP indicator acts as Support as well as Resistance. In the above Image we can see the price trend takes 3-4 times here and takes a long run.
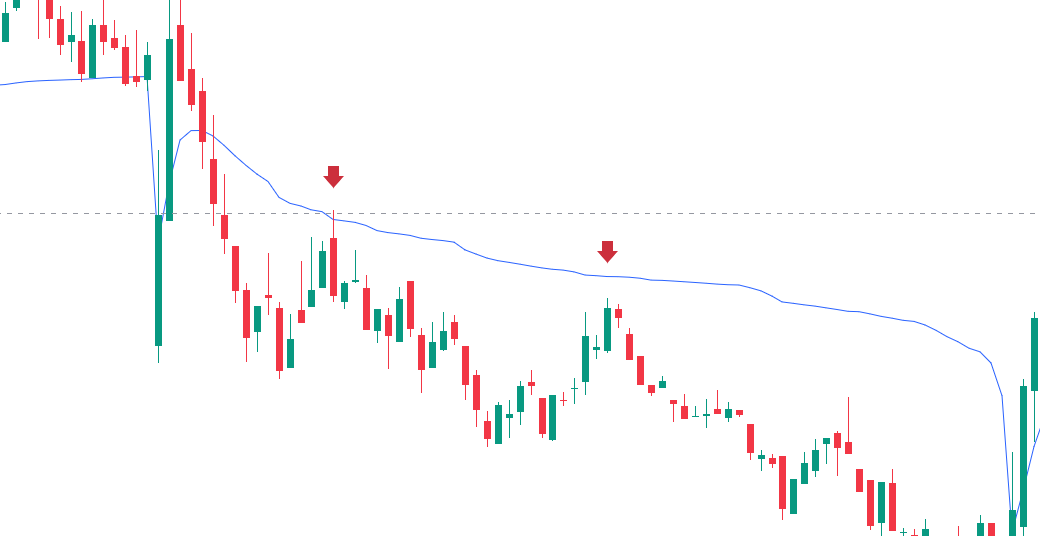
Resistance: As the trend moves below the Indicator, the indicator acts as resistance to the trend. Red Down arrow indicating the price each time trying to move higher it faces resistance from VWAP and finally the price fell and continues the downtrend.
VWAP Pullback with Fib Tool
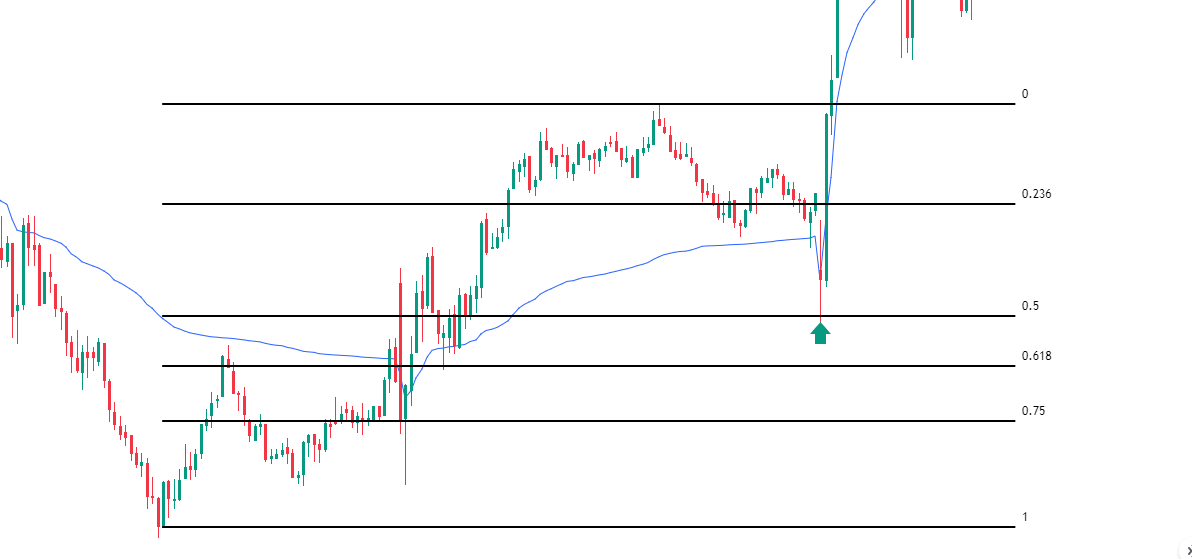
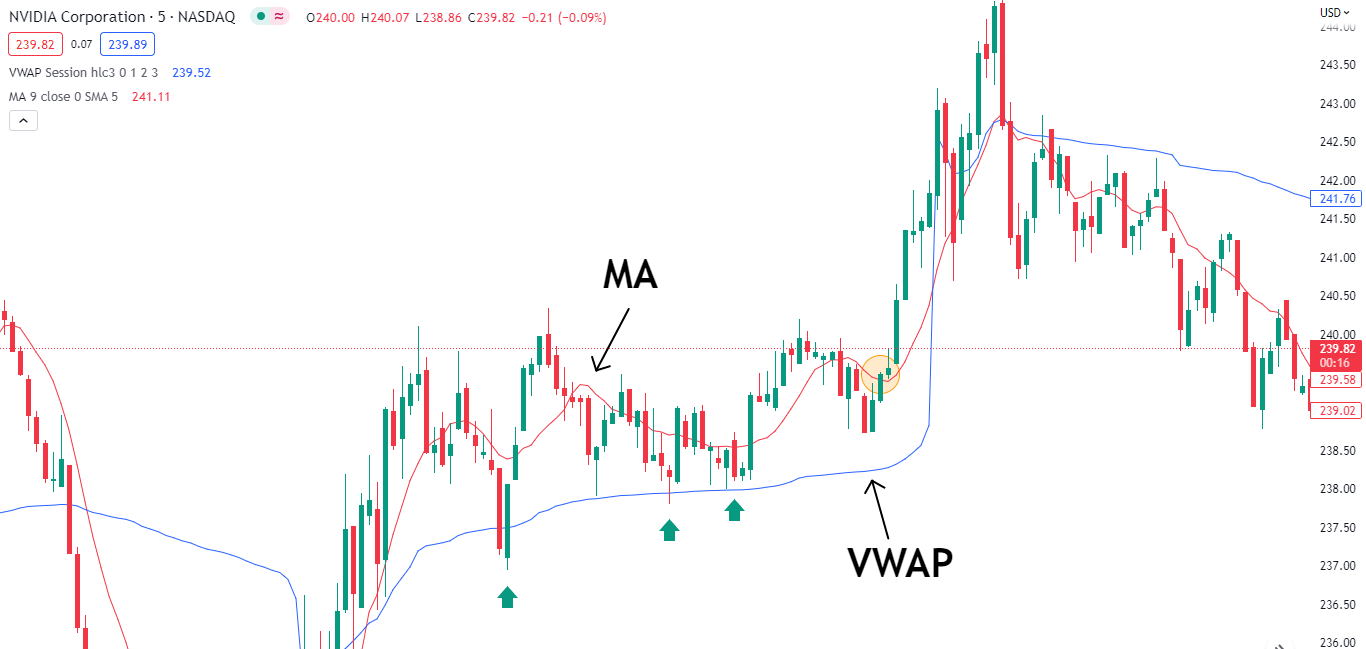
In the 5-minute NVDA chart above you will notice price breaks above the VWAP resulting a bullish move and then the price comes back to retest the VWAP where our 0.5 fib level lies, this confluence is a better confirmation. A strategy that a lot of traders use is to long when prices close above this confluence.
This is a great area to open a long position because you know if it closes on the other side of where you got in, then it’s time to get out and move on the next trade.
For profit targets you want to see it break highs, where can even add more size, and then start to take profits as it works in your favor.
Avoid fake breakouts
Price will stay and trade above VWAP if there is buying pressure from institutional traders. If a large investment bank is interested in taking the position, a stock will often stay above VWAP and keep moving above VWAP.
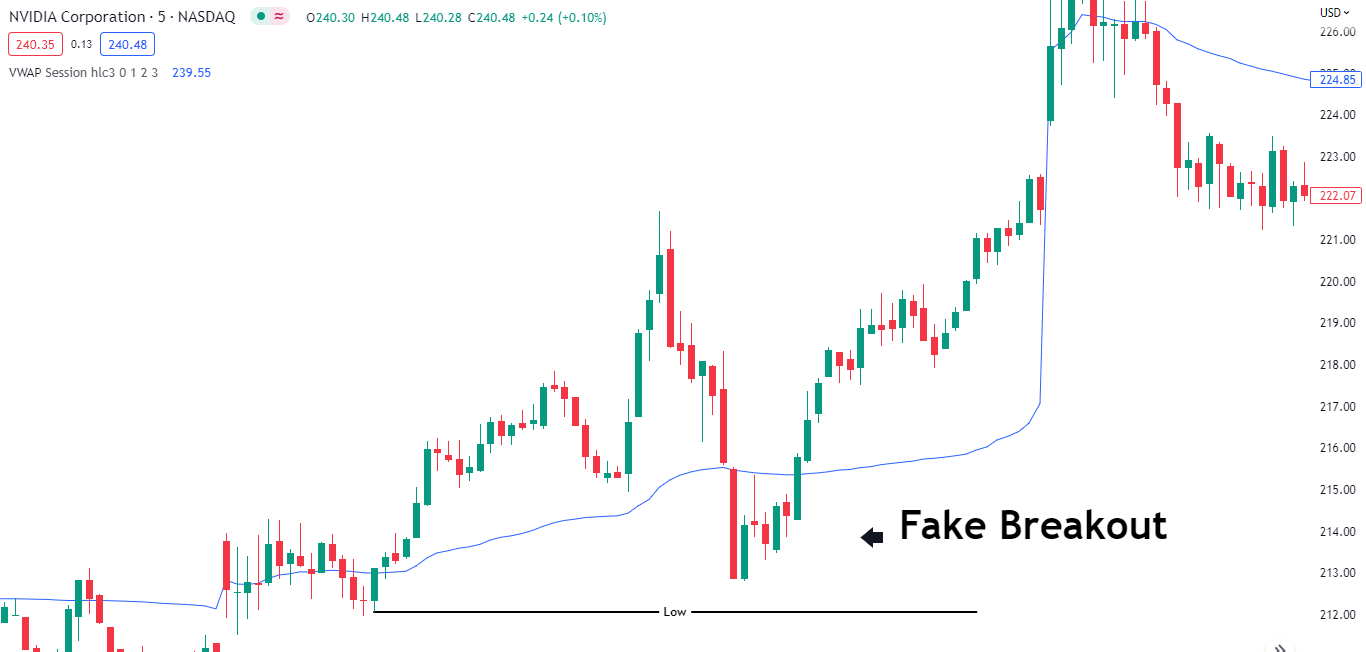
But if there are no large institutions behind the stock, or if they fill all of their orders, then the stock will move back to VWAP and often “lose it”, meaning it will drop and trade below the VWAP. This is a sign for short sellers to start shorting it.
On the other hand, when a stock below the VWAP bounces back and breaks out above the VWAP, it means the buyers are gaining control and short-sellers desperately have to cover. Smart day traders chase the fleeing shorts by going long to ride the momentum and “squeeze the shorts”. Price action and volume play a major role
In this case, have a look at the above image, big red candle forms below the VWAP, but refuses to break the swing low. Taking all the liquidity here price continues to move above the VWAP forming a fake breakout.
Note: To avoid trading at the opening of a trading session

Price bars and the VWAP indicator frequently cross after the market begins. A intense trading involving overnight day traders, new investors, and institutional traders takes place in the first five minutes. The market bias cannot be assessed, in accordance with our methodology, unless the market tries to deviate from it.
The price will move in one of two directions: towards or away from the VWAP once volatility starts to decline ten to fifteen minutes into the Open. This is a test to check if a sizable investment banks are on the market open, either to purchase or sell.
The price will cross the VWAP and rise much higher if a big institutional trader is looking to purchase a sizeable position.
Which Chart Is Most Useful for Spotting Trends with VWAP?
The most useful chart for spotting trends with VWAP (Volume Weighted Average Price) is the intraday chart. Intraday charts show the price movement of a security over a specific period of time, usually a day or less. The VWAP is calculated over the same period, making it easier to identify the trend of the market.
Intraday charts are useful for day traders who are interested in short-term price movements and want to identify trends quickly. The VWAP is a useful tool for intraday traders, short term traders as it provides a reference point for identifying the trend and potential support and resistance levels.
Traders can use a variety of intraday charts, such as tick charts, minute charts, or range charts, to spot trends with VWAP.
Tick charts show the price movement of a security based on the number of trades, while minute charts show the price movement based on a specific time interval, such as one minute time frame. Range charts show the price movement based on a specific price range.
Regardless of the type of intraday chart used, traders can plot the VWAP on the chart to identify the trend of the market.
Limitations of VWAP in Trading Strategies
VWAP (Volume Weighted Average Price) is a widely used benchmark in trading, particularly in algorithmic and quantitative trading. However, there are several limitations to using VWAP as a trading strategy or benchmark:
Limited accuracy:
VWAP is calculated over a specific time period and is based on the volume-weighted average price of trades during that period. However, the VWAP may not accurately reflect the price movement of the security, especially during periods of low trading volume or when large trades occur outside the VWAP period.
Delayed execution:
To execute trades at or near the VWAP, traders need to be patient and wait for the VWAP to be calculated, which can lead to delayed execution. This delay can result in missed trading opportunities or worse execution prices.
Limited applicability:
VWAP is most effective for liquid and actively traded securities. For less liquid securities, the VWAP may not accurately reflect the true market price, and using VWAP as a benchmark or trading strategy could result in poor performance.
Inability to account for market events:
VWAP is calculated based on past volume and prices, but it does not take into account market events that may affect the security price. These events could include news releases, economic data, or unexpected market events, which could cause the price to deviate significantly from the VWAP.
Price impact:
Traders using VWAP as a benchmark or trading strategy may cause price impact, particularly if they are trading large volumes of securities. This could lead to a significant deviation from the VWAP price, resulting in poor execution prices.
Overall, while VWAP is a useful benchmark and trading strategy, it is important for traders to be aware of its limitations and to use it in conjunction with other tools and strategies.
The Significance of VWAP trading strategies
Since the VWAP calculation is based on historical data it is still considered a lagging indicator, but that doesn’t stop traders from using this measure to establish support and resistance levels suitable for intraday trading.
Conclusion
The Volume Weighted Average Price (VWAP) is a popular TA tool used by traders and investors to determine the price of a security based on its volume.
Traders and investors can use the VWAP to identify overbought and oversold conditions, find support and resistance levels, make buy and sell decisions, and evaluate trading performance.
While the VWAP is a useful tool, it should be used in conjunction with other indicators like Relative Strength Index, and analysis methods to make informed trading decisions.


