

A double bottom pattern is a commonly used chart pattern in technical analysis. It is more specifically a bullish reversal pattern which is seen at the bottom of a downtrend and indicates that the seller, who so far controlled the price action, is losing momentum, creating possible long entries for buyers.
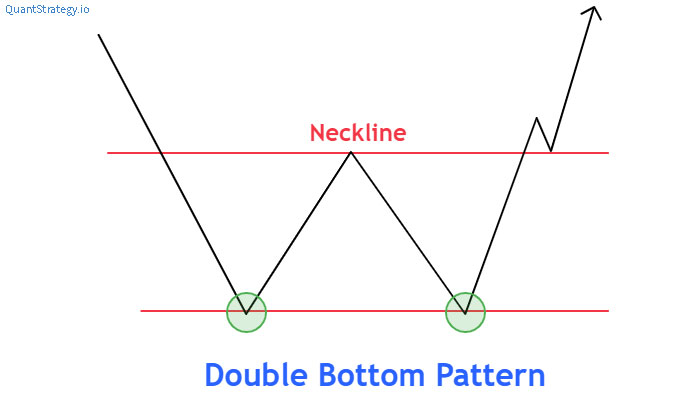
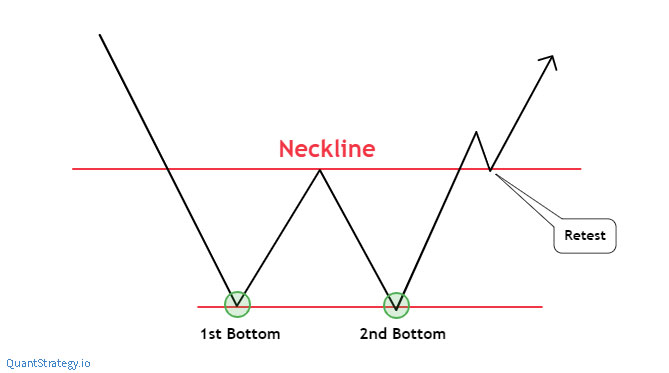
It consists of two swing lows (bottoms) that form at a key support level and a swing high that occurs between them. The pattern looks like the letter ‘W’ because of two touched lows and a shift in the trend direction i.e. from a downtrend to an uptrend.
Below we shall discuss what a double bottom pattern is and most importantly, how to trade these chart patterns in a financial market.
What is a Double Bottom Pattern?
Double bottoms are a price action formation on charts that consist of two swing lows, which end nearly at the same level, and a swing high between them. The point where two swing lows end around the same level becomes a key support level. Similarly, the line that connects the swing high with the prior swing high develops into a resistance level known as the neckline. These chart patterns become active when the price break occurs above the neckline.
Double-bottom chart patterns are observed in a downtrend and can signal the termination of the downtrend or a lengthened pullback in an uptrend. This is why it is considered a bullish reversal pattern. The pattern demonstrates that the price is ready to turn and begins heading upwards. So traders search for long positions when the price break occurs above the neckline.
According to the standard rule of technical analysis, the twice-touched low turns into a support level. The seller is unable to mark a new low below the preceding low, providing the buyers a chance to shoot the price higher. Subsequently, we get two bottoms- two lows that look like the letter ‘W’.
It is usually considered problematic when two consecutive bottoms have a short span in between their formation as this comprehends that the downtrend is very powerful thus, the prevalent bearish trend is possible to continue. This is why the most effective bottom pattern is the one that has a certain time in between the two lows.
Key Elements
The double-bottom formation has three parts:
- First low – first price reversal
The market goes higher after a powerful downtrend. It then creates a swing low when the price action is lower from any of the prices over a specified time, for instance, the recent week’s lowest price. At this point, it is possibly just a retracement within a downtrend and not a sign of price trend reversal.
- Second low – second price reversal
A second drop in the double bottom formation comes into play as the financial market discounts the prior trend and the buying pressure rises. With its formation, there are signs of an uptrend and price reversal. But it’s still early to conclude whether prices will continue rising.
- Neckline – the area of resistance
It is the top price an asset can attain over time in an up-trending financial market. A double-bottom chart pattern is complete when the price breaks above this area of resistance. This indicates a greater buyer-to-seller ratio and that the trend will possibly continue rising.
Example of a Bottom Pattern
By now, you must have understood the dynamics and characteristics of the double bottom pattern. So let’s look at some of its examples.
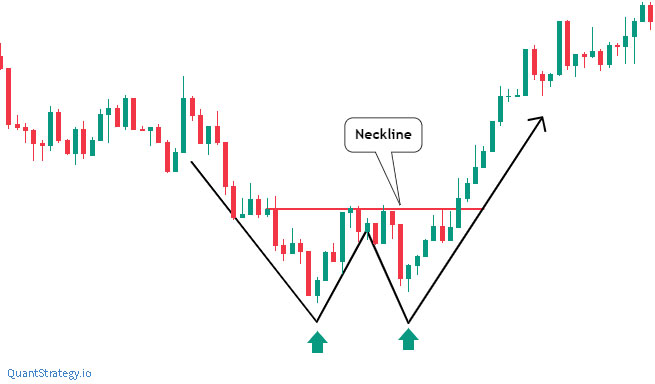
The chart pattern above illustrates a bottom pattern on the NZDUSD daily chart. You can see the well-defined and clear neckline and two swing lows, forming a good ‘W’ pattern.
But at what moment these chart patterns can be confirmed as a bottom pattern in the market? Consider the following to know the answer.
Note how the circled close is back above the neckline now. If you see closely, two days ago there was a daily close slightly above this level, however, it was not a very persuasive close. In such a situation, it is preferred to wait for a more persuasive and better close, that in this case, came after two days.
Note: Since this double bottom is best observed on the daily chart, you’ll prefer to wait for the close above this point on the daily interval. We had a complete double bottom immediately once the circled candle closed.
Trading the Double Bottom Pattern
The first thing to understand in regards to trading the double bottom chart pattern is to search for the entry signal. Traders usually face a misconception that entry takes place on the breakout of the chart pattern when actually, the entry occurs on the retest of the neckline.
Here is an example of a neckline retest:
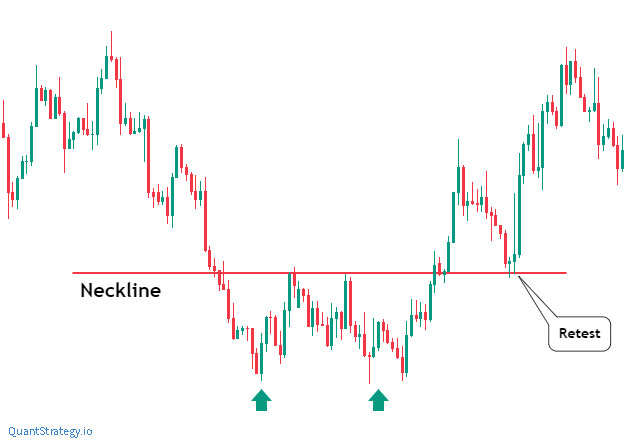
You may notice in the above chart how the financial market retests the neckline as new support. As the market alters direction, this retest presents a chance to traders to buy at support.
Now let us see the NZDUSD double bottom example again to find the point to enter long on the retest of the neckline.
In this situation, we could have waited for the retest of the neckline as new support. We’d then have drifted to a lower time interval to search for bullish price movement to confirm that this position is possible to hold.
You may note how the market revived immediately after the neckline retested as new support.
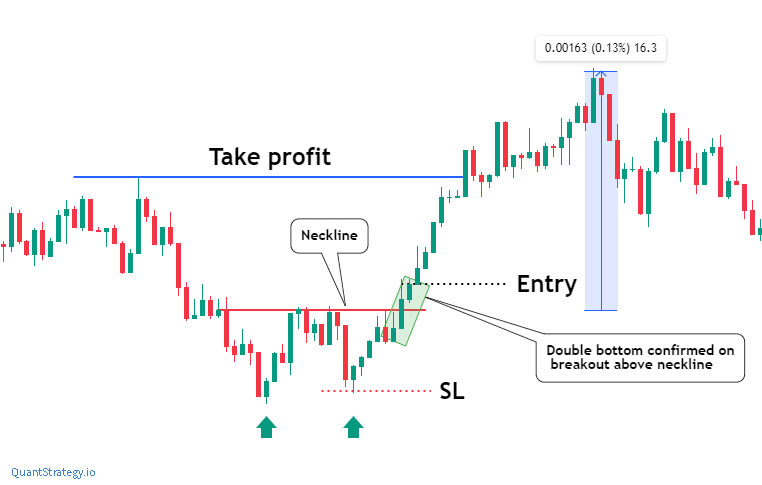
Another way of trading the double bottom chart pattern is to enter the trade when the asset’s price breaks the neckline of the chart.
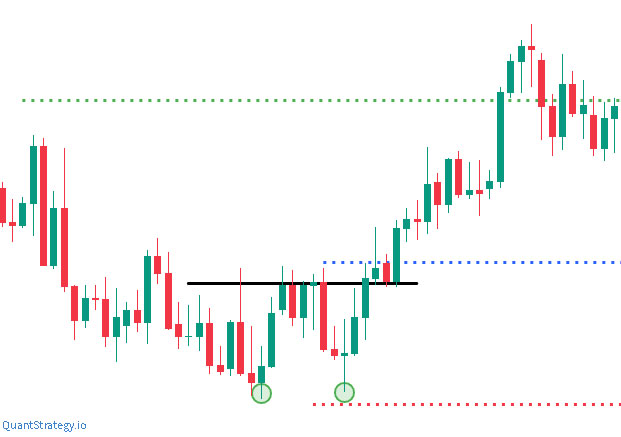
- Blue line: enter when an asset’s price breaks the neckline
- Red line: place a stop loss order right below the creation
- Green line: consider the height of the double bottom formation and position a win target above the neckline
In this method, you can enter a trade immediately once the pattern becomes active and the price breaks the neckline. The trader may place the stop loss order right below the lows along with the profit target above the neckline (the distance must be equal to the length between resistance and lows – the pattern’s height).
Double Bottom Patterns Pros & Cons
Like any other pattern of technical analysis, a bottom pattern also has its strengths and weaknesses. Some of them are below:
Pros
- Traders can trade bottom patterns in any time interval, from M5 to W1 or D1.
- A bottom pattern is often seen in price charts.
- Double bottoms can be traded in cryptocurrency, Forex, stocks, commodity market, and bonds.
- Double bottom trading has well-defined rules to ascertain entry and exit points that reduce risks.
- A bottom pattern helps define pivot levels that give benefit an analysis.
Cons
- There can be bullish traps and false breakouts along with bottom patterns. These things can particularly happen in shorter time intervals because the overall trend stays bearish in a longer time interval. In such a situation, you’ll trade against the trend, which isn’t safe.
- A triple bottom can often form, which can cause confusion for traders. In such a case, the trade isn’t entered rightly. One must always set up stop losses to minimize the risks of losing money.
Conclusion
Double bottom patterns are a powerful reversal signal whose formations are among the most important chart patterns to identify long-term trend changes and signal a considerable low has been reached for the predictable future.
It is noteworthy that the chart pattern has its drawbacks, and all possible risks must be assessed before trading it. However, this pattern has a credible trading system, following which traders can make stable profits.


