Candlesticks offer thorough, real-time price information and form the basis of technical analysis. Their size and shape tell a substantial price action story. For this reason, traders search for candlestick patterns while trading. Like single candlestick patterns, double candlestick patterns provide an extensive picture of market sentiment.
They are a combination of two candlesticks, which form together and are employed in technical analysis to predict an asset’s future price direction. This helps traders identify potential reversals or continuation of a trend as well as pick out possibly lucrative trading opportunities.
There are some dual candlestick patterns, which traders should be on the lookout for as they go into charts. Keep reading below to learn more about dual candlestick patterns and the ways they can provide an advantage to traders.
List of Dual Candlestick Patterns
Candlesticks patterns can comprise one candlestick or more than two candlesticks and can make reversal or continuation patterns. Here are some of the most popular and useful candlestick patterns.
Engulfing Candlestick Pattern
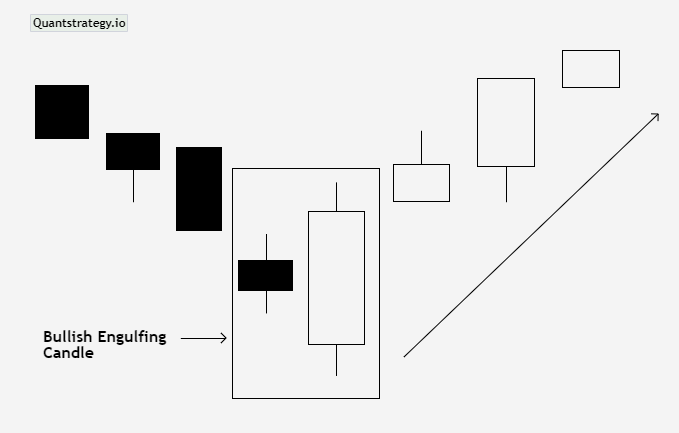
The engulfing candlesticks are two-candlestick reversal patterns, which depict a strong reversal signal in the market. The idea behind it is that the first candle is followed immediately by a bigger one in the opposite direction. This pattern has two types – a bullish engulfing pattern and a bearish engulfing pattern. These are the most basic type of double candlestick formation.
A bullish engulfing pattern is a two-candlestick reversal pattern, which occurs at the termination of a downtrend when a bearish candle is followed by a larger bullish candle where the latter ‘engulfs’ the former. According to the pattern, bulls are performing better than bears. The length of the body influences the likelihood of a trend reversal – the higher the likelihood when the bullish candle is longer and the bearish candle is shorter.
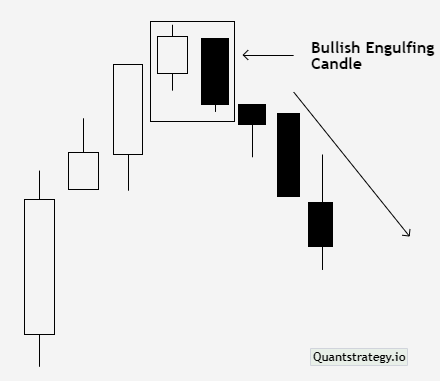
A bearish engulfing pattern is just the opposite. It occurs when the bullish candlestick is immediately followed by a larger bearish candle at the termination of an uptrend, which completely ‘engulfs’ it. The pattern demonstrates that bears are performing better than bulls, alerting investors regarding a potential downward reversal. The length of the body again influences the likelihood of a trend reversal – the higher the likelihood when the bullish candle is shorter and the bearish candlestick is longer.
Tweezer Candlestick Pattern
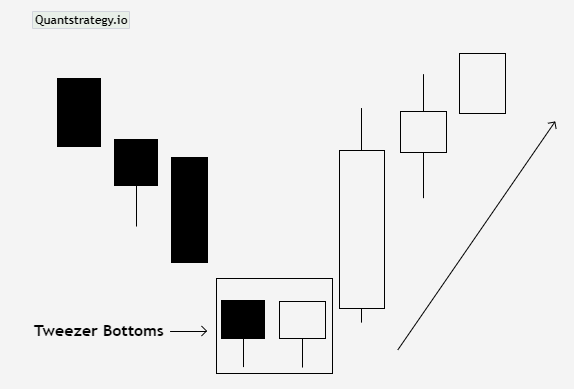
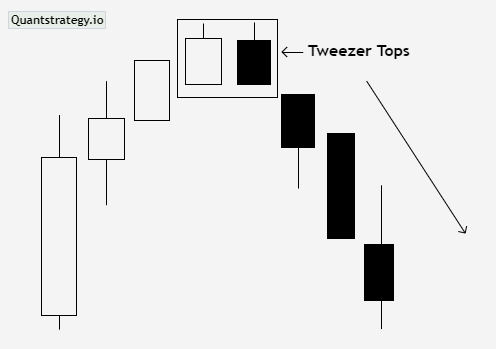
Tweezer patterns are another type of double candlestick pattern. Its two versions, the tweezer top and tweezer bottoms, signal a possible price reversal after an extended uptrend or downtrend. The name of the formation is due to the double highs of the tweezer top or double lows of the tweezer bottom that must be of equal length.
A tweezer bottom delivers a bullish indication emerging at the end of a downtrend. The first candle of its two candlesticks is bearish, having a moderate-length shadow under it. The second candle is bullish, which can be of any size, however, if it is larger than the first candle, the signal is considered stronger. The pattern implies market uncertainties as the downtrend does not continue. It is confirmed when the subsequent candles are also bullish.
A tweezer top is just the opposite. It occurs at the peak of an extended uptrend and signals a downward reversal. It has a bullish first candle that depicts a rejection of higher prices, and the second candle tries but fails to increase higher. This suggests that resistance is powerful, and the market can follow a period of consolidation or may decline. The second candle can be of any size, however, if it is more significant compared to the first candle, the signal is more powerful.
Harami Candlestick pattern
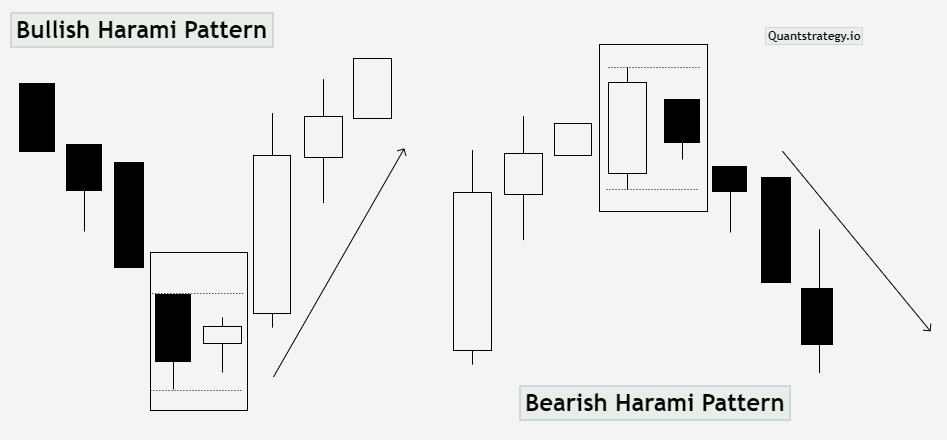
Another kind of double candlestick formation is the harami. The word ‘harami’ means pregnant in Japanese. The term describes the appearance of the pattern that resembles the body of a pregnant woman with a small candle ‘inside it’.
The harami pattern is made by two consecutive candles. The first candlestick is large and has small shadows and a long body. The second candlestick is small and has a body, which is entirely inside the body of the prior candle. In an uptrend, the first candlestick is green, and the second is red. This serves as a potential reversal sign.
Similarly, the first candle is red, and the second is green in a downtrend. This indicates a good time for buying opportunities.
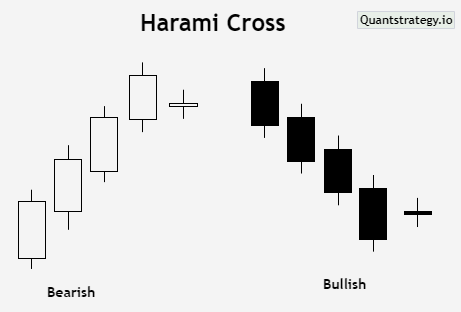
A variation of the harami pattern is the harami cross in which the second candlestick is a doji candle that is inside the first candlestick. This also entails a bullish and bearish version, and both indicate a possible price reversal.
It is considered significant when it emerges in a downtrend if the bullish pattern and in an uptrend when bearish pattern.
Piercing Line
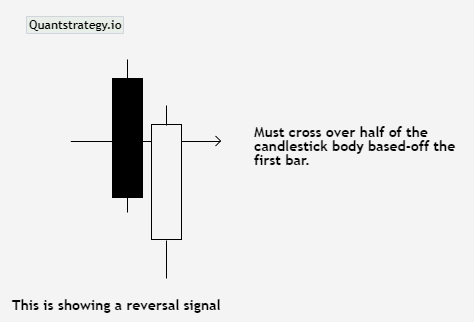
The piercing line is another dual candlestick pattern that may appear during a pullback with the prediction of a bullish trend or at the bottom of a downward trend at the support level. The pattern involves a long red candle, which is followed by a long green candle.
The important aspect of this formation is that there is a considerable gap between the closing price of the red candle and the open price of the green candle.
Additionally, the close should span at least half of the red candlestick’s body from the previous day. It indicates buying pressure when the green candle closes substantially higher than the open.
The piercing line pattern indicates a possible short-term upward reversal, particularly if the following candle is bullish.
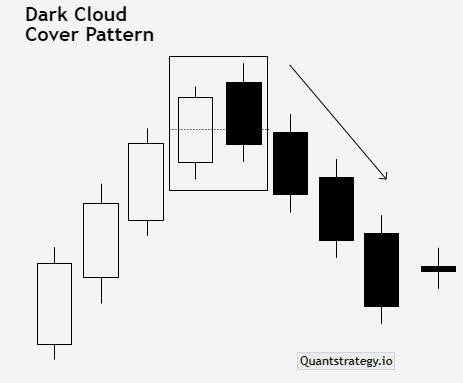
Dark Cloud Cover
The dark cloud cover is similar to the piercing line but is its inverse. It comprises two candlesticks and anticipates a bearish reversal.
The first candlestick is a long green candlestick, which is followed by a long red candlestick that opens above the previous day’s candle but closes below the midpoint of the first day’s candle.
Both candles should be fairly large, indicating active engagement on the part of traders and investors. It is often less important when the pattern appears with small candles.
The dark cloud cover informs that bears are taking over and bulls are losing control. The trader can anticipate a strong downtrend if the shadows of the candlesticks are short.
Dark Cloud Cover implies a brief downward reversal, particularly if the following candle is bearish.
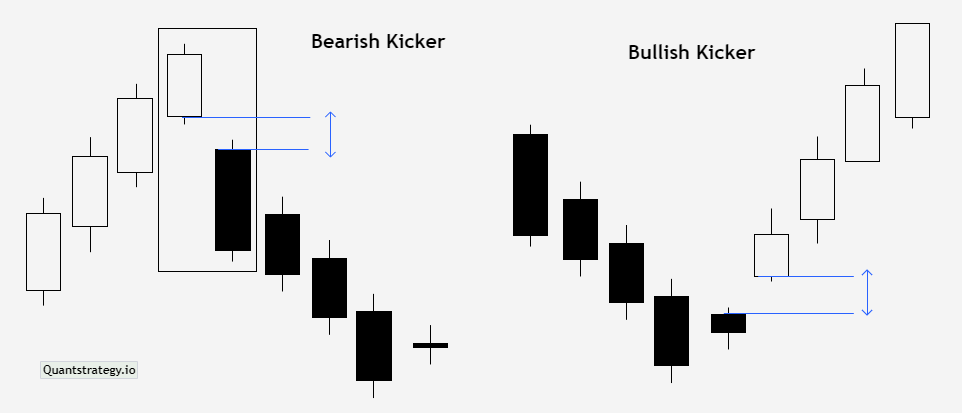
Kicker
The last two candlestick patterns on our list is the kicker pattern. This pattern features a price gap between the candlesticks. The first candle continues the set trend, and the second candle opens with a slight gap and moves in a direction opposite to the prior candle.
The kicker pattern is one of the reliable reversal patterns. It can be bearish or bullish.
The bearish kicker pattern occurs in a bullish price movement. It comprises a bullish candle that continues an uptrend, followed by a bearish one that opens at the same level or lower than the opening of the previous candle.
The bullish kicker pattern occurs in a bearish price movement. It comprises a bearish candle that continues a downtrend, followed by a bullish one that opens at the same level or higher than the opening of the previous candle.
The candles in the kicker pattern never overlap one another and usually contain very small shadows or they do not have at all.
Both the bearish and bullish kicker patterns offer strong indications for trend reversal. The bigger the gap, the stronger the reversal.
When a trader spots a bearish kicker pattern, it may be an indication to go short. Conversely, if they identify a bullish kicker pattern, it may be a sign to open long positions.
Conclusion
The effectiveness of dual candlestick patterns in financial trading has withstood the test of time. As they frequently occur on price charts and provide powerful signals, traders and technical analysts incorporate them as a component of their analysis while making trading decisions. Besides using them as a separate tool, professional traders use them in conjunction with technical indicators to get more trustworthy alerts on price movements.