


Trading analysts are always interested in looking for data that offers them valuable insights. Historical analysis specifically entails looking through historical data to determine what occurred so that management may determine how the business can profit from it. In essence, they are searching for trends.
What we mean here is finding trends in data or, if not, figuring out what the data they’re examining has in common. Trend analysis is one such method that financial analysts can employ to assess business performance, make predictions about upcoming changes, and implement appropriate corrective measures.
Trend analysis helps corporations to understand their environment better and make informed decisions, which will keep them competitive.
Read on to learn more about trend analysis, the different types of trends, and commonly used techniques and metrics. But first, let’s start with understanding stock market trends.
What are Market Trends?
The trend is the direction in which stock price moves. Share prices typically rise or fall under bearish or bullish market sentiments. Since stock prices can be quite volatile in the short term, they usually do not move in a straight line. Investors must take into account a specified timeframe to interpret stock price swings as a trend.
When investors consider a bit longer-term price swings, a far more distinct market trend can be identified. In other words, it is simpler to spot a trend the longer it continues in either direction.
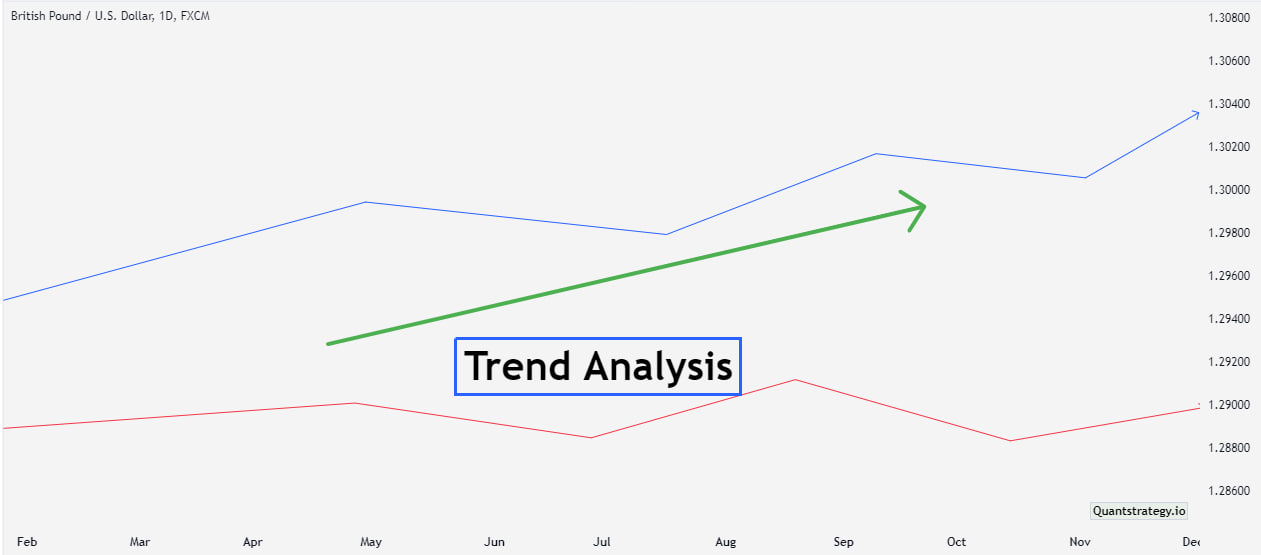
What is Trend Analysis?
A trend analysis is a comparison of a company’s financial statements to a market trend or an analysis of the future based on past performance results to make the best investment decisions based on the outcomes of the analysis.
Trend analysis involves gathering data from several time periods and charting it on a horizontal line to discover actionable patterns from the provided information. Financial experts recognize trendlines, which are lines connecting data points that let analysts spot upward and downward market tendencies. Trend lines enable financial experts to examine historical data and forecast the direction of the market within a certain industry.
This technique’s objective is to evaluate how a market has changed from one period to another. You can identify patterns and predict future events by comparing data over a given time period. To put it another way, the foundation of trend analysis is the notion that you can forecast what will happen in the future based on what’s already occurred in the past. The more relevant data you have, the better you can predict along trend lines.
Types of Trends

The three main types of trends to know are as follows:
Uptrend
When financial markets and assets rise and continue to increase stock prices, asset values, or even the size of the economy over time, this is known as an uptrend or bull market. It’s a prosperous time where lots of new employment is getting generated, the economy is moving into a strong market, there is optimistic market sentiment, and the beginning of the investment cycle.
An upward trend may coincide with beneficial adjustments in a company’s business model or macroeconomic security. It is defined by financial analysts as higher peaks and troughs, or high points and low points on a graph, in the data over time.
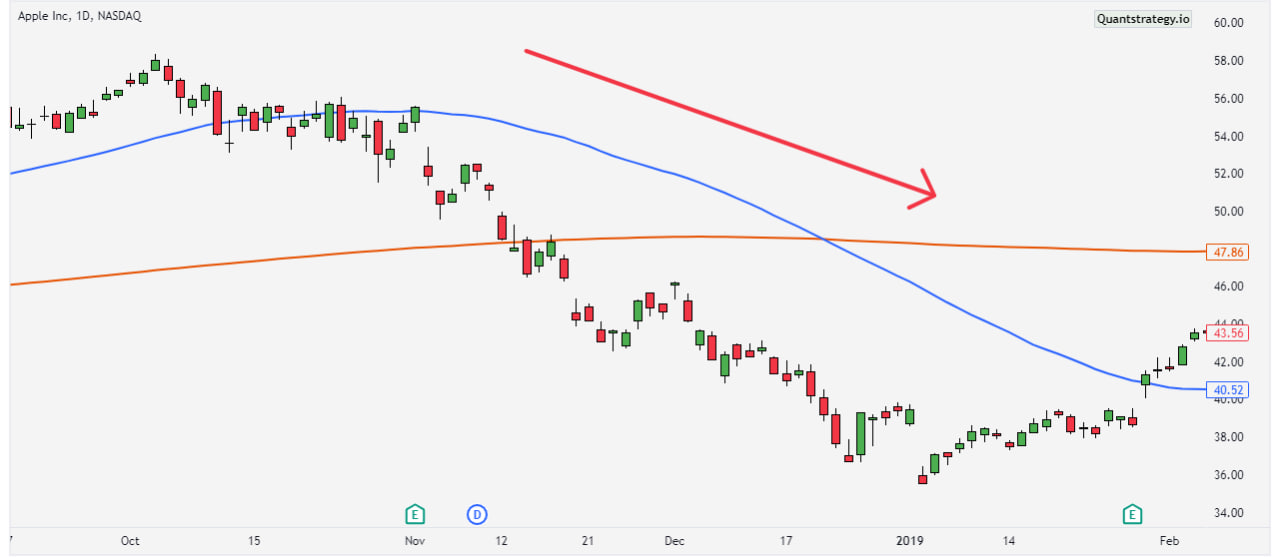
Downtrend
A decline in sales caused businesses to close their operations or reduce their production. A downtrend or bear market occurs when financial markets and asset values, together with the overall level of the economy, go downward, and prices of stocks, assets, or even the size of the economy continue to decline over time. Asset prices begin to fall, jobs are lost, the market sentiment is unfavorable for new investments, and investors flee to the haven of the investment.
While prices may occasionally rise and fall, a downward trend happens when there are lower peaks and troughs in the data over time.
Sideways / Horizontal Trend
A sideways trend or horizontal trend is when asset or stock values, like those of the broader economy level, are not advancing in any particular direction but are fluctuating sideways, up for a while, then down for a while. It is impossible to predict which way the trend will go. It’s the trend where the government is attempting to propel the economy in an upward trend as investors worry about their investments. Generally, horizontal trends are considered risky because it is impossible to foresee when sentiments will shift against them. As a result, investors strive to avoid such a situation.
What Function Does Trend Analysis Serve?
The main use of trend analysis lies in technical analysis. Let’s learn about it in greater detail.
Technical Analysis
An investor may construct a trend line with the use of past stock prices that will help him forecast how the price of the stock will move in the future. The trend may be connected to the provided information. Before concluding the trend analysis, cause and effect relationships must be investigated.
- Trend analysis helps in finding patterns that develop over time, such as a head-and-shoulders, reverse head-and-shoulders pattern, or cup-and-handle as well.
- Technical analysis can be applied to the stock market, derivative market, and foreign currency market. The same approach may be applied to all markets with just minor adjustments.
Trend Trading Strategies
Trend traders try to identify and capitalize on trends. Numerous trend trading strategies make use of various technical indicators:
Moving Average
Moving average, also known as MA, is a stock indicator that traders use while performing technical analysis in the world of finance. Moving averages are primarily calculated to lessen the effect of short-term price swings on a stock over a given period.
This trading method involves entering long positions when a short-term MA crosses over a long-term MA. Conversely, traders that use this method open short positions when the short-term MA crosses below the long-term MA.
This is illustrated in the example of Tata Motors Ltd. below.
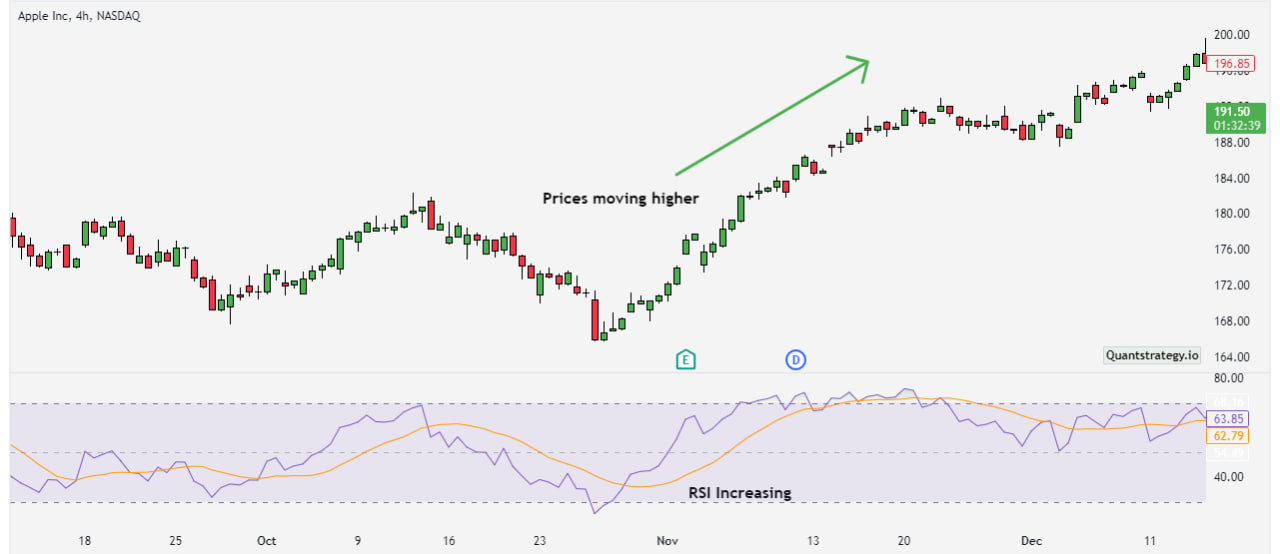
Momentum Indicators
This tool can be used to assess the strengths and weaknesses of the price of a stock. Momentum measures the speed at which a stock’s price rises or falls. The relative strength index (RSI) and moving average convergence divergence (MACD) are two popular examples of momentum indicators.
We shall learn the momentum indicator strategies for the relative strength index here.
Relative Strength Index (RSI)
The RSI is used to spot overbought or oversold indications as well as price momentum. To achieve this, it examines the average gains and losses over a specific number of periods, often 14, and determines whether more price moves were positive or negative.
The RSI is displayed as a percentage that shifts between 0 and 100. The market is considered “oversold” when the indicator falls below 30 and “overbought” when it rises above 70. Traders use these levels as indicators that a trend may be maturing.

It is important to remember that the market may remain in an overbought or oversold condition for a long time. Because the market price can move over a far wider range of values than the RSI, which only varies between 0 and 100, the RSI is not always a warning of an impending shift in trend.
The overbought signal is typically used by a trend trader with a long position as a price point to lock in a profit and close the trade. A trader intending to enter a short position would take the overbought signal as their entry point, though. Trend traders who use the oversold signal would do the opposite: they would use the oversold signal to exit short trades and enter long ones.
Trend lines & Chart Patterns
In technical analysis, trendlines are a series of lines and curves that are used for identifying patterns. This tool can be used by traders to spot support and resistance on a stock chart.
People who use this stock market trend analysis approach enter a long position when the equity shares of any company are heading upward. The stop-loss order for this strategy must be placed below the resistance or support levels, i.e., the important trendline.
Consider Reliance INDS as an example once more.
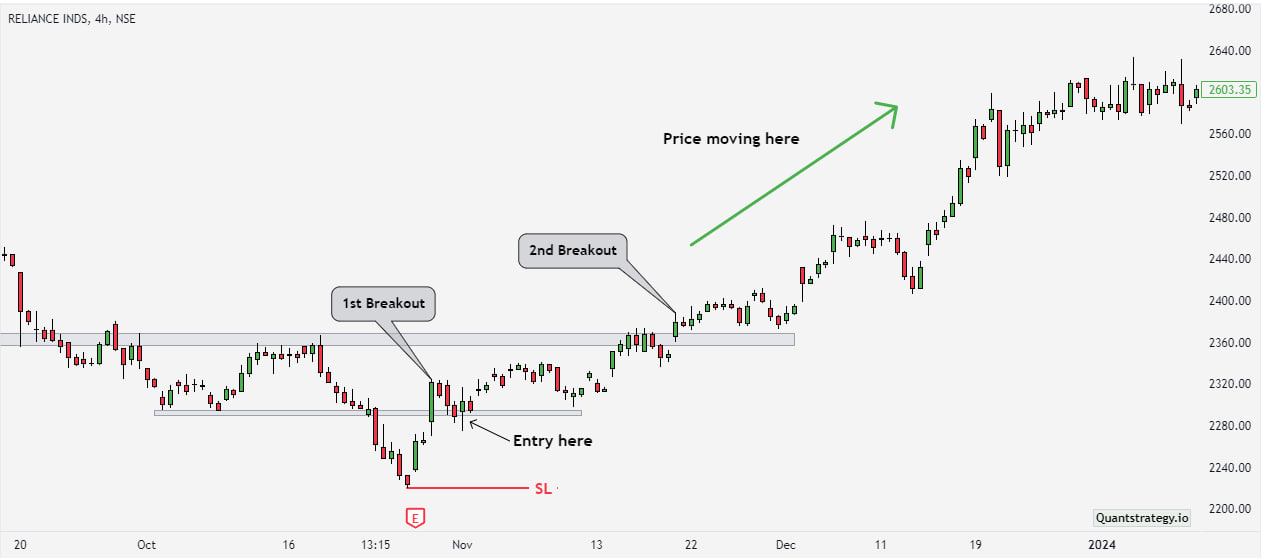
Here, we can see when the price of this automaker’s shares is on the rise. In this scenario, a stop-loss order can be placed at or below the support region.
Bollinger Bands
Bollinger Bands are fundamentally a deviation-measuring tool, which makes them an important instrument for trend diagnosis. We can view pricing in a completely new way by creating two sets of Bollinger Bands – one set employing the parameter of “one standard deviation,” and the other set using the conventional setting of “two standard deviations.” This Bollinger Band is what we’ll refer to as “bands.”
For instance, the chart below shows that the trend is upward whenever the price remains within the upper Bollinger Bands that are +1 SD and +2 SD from the mean. Accordingly, we can refer to that channel as the “buy zone.” On the other hand, if the price channels between the Bollinger Bands -1 SD and -2 SD, it’s in the “sell zone.” Finally, the price is effectively in a neutral condition and lies in an unexplored terrain if it oscillates between the +1 SD band and the -1 SD band.
Bollinger Bands dynamically adjust to the price movement as volatility rises and falls. As a result, the bands inevitably spread and narrow in time with price movement, producing an extremely precise trending envelope.

These market trend trading strategies help traders simplify the price information of the stocks. Additionally, they offer trade signals and trend reversal signs to technical analysts. Traders can combine these trend analysis techniques and adjust them according to their trading style.
Why is Trend Analysis Important?
- A common saying in the market is that “the trend is the traders’ best friend.” Until and unless evidence indicates a trend reversal, such as a shift from a bull to a bear market, trend analysis looks for trends like a bull market run and tries to capitalize on those trends. The traders will benefit the most from it since they will earn if they follow trends rather than going against them.
- In a bullish or bearish market, trends can be both increasing or decreasing.
- A trend is nothing more than the general direction the market is moving at a given time. There are no standards for determining the length of time needed to identify a trend; nevertheless, generally speaking, the more prolonged the direction, the more reliably taken into account. Some indicators are created based on experience and some empirical research, and standard times are maintained for such indicators as the 14-day, 50-day, and 200-day moving averages.
- While there isn’t a set minimum amount of time needed for a direction to be termed a trend, it becomes more noticeable the longer the direction is maintained.
Limitations of Interpreting Trend Analysis
While performing trend analysis and making judgments based on your results, it is crucial to keep in mind that trend analysis forecasts are never completely correct. Furthermore, while it’s true that previous behavior typically predicts future behavior, this isn’t always – or usually – the case. As a result, it’s essential to examine the results of your trends analysis carefully and act only when you are certain that your interpretation of the market is correct.
Conclusion
Trend analysis has a big impact on how a firm will develop in the future. Based on historical data, this method seeks out trends and identifies problems that might be preventing an organization from moving forward.
With the appropriate controls and tools in place, you can identify trends in the workflows of your business as well as those in your industry and the market as a whole. You can then analyze trends to find the useful information you need to reduce costs, lower your total cost of ownership, and make sure that every dollar you invest now and in the future generates measurable value and the highest possible return on investment.


