

In the world of technical analysis, traders and investors use a wide range of indicators to identify trends and make trading decisions. One such indicator is the Volume Rate of Change (VROC), which measures the rate at which trading volume changes over time. In this blog post, we’ll explore what VROC is, how it works, and how traders can use it to confirm trends.
What is VROC Indicator?
The Volume Rate of Change (VROC) is a technical indicator that measures the rate at which trading volume is changing. It is calculated by taking the percentage change in volume over a specified period. The VROC indicator helps traders and investors to identify trends, as changes in trading volume can indicate shifts in market structure.
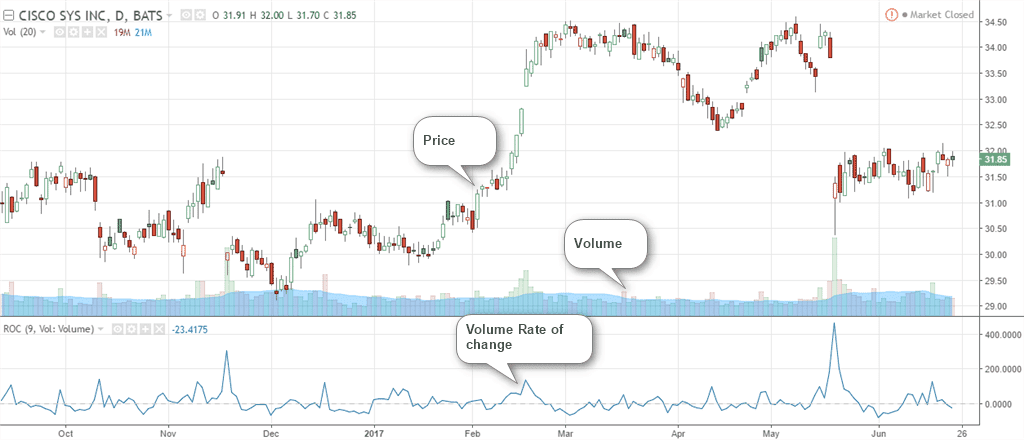
The VROC indicator can be plotted as a line on a price chart, just like other technical indicators such as moving averages or the Relative Strength Index (RSI). Typically, VROC is displayed as a histogram or a line chart, with values above and below the zero line indicating bullish and bearish trends, respectively.
The formula for VROC is as follows:
VROC = [(Current Volume – Volume n periods ago) / Volume n periods ago] x 100
Here, “n” represents the number of periods you want to compare. For example, if you are looking at a daily chart, you might compare the current day’s volume to the volume 20 days ago to calculate the VROC for the last 20 days.
How to Calculate VROC Indicator
In this case, to calculate VROC, you need to follow these steps:
- Choose a time frame: First, you need to choose a time frame that you want to analyze. This could be any time frame, such as daily, weekly, or monthly.
- Calculate the volume for the chosen time frame: Once you have chosen the time frame, you need to calculate the volume for each day or period. For example, if you are analyzing a daily chart, you would calculate the volume for each day.
- Choose the number of periods to compare: Next, you need to choose the number of periods you want to compare. This could be any number of periods, such as 10, 20, or 30.
- Calculate VROC: Finally, you can calculate VROC by using the formula mentioned above.
Once you have calculated VROC, you can plot it on a chart and use it to identify trends.
Using Volume Rate Of Change To Confirm Trends
VROC can be used in conjunction with other technical indicators to confirm trends and identify potential trading opportunities. Here are some ways in which you can use VROC to confirm trends:
- Identifying Bullish Trends
When the VROC line is above the zero line, it indicates that trading volume is increasing, which is often seen as a bullish signal. Traders can simply use this as a confirmation of a bullish trend, especially if other technical indicators such as moving averages or the RSI are also indicating an uptrend.
- Identifying Bearish Trends
Conversely, when the VROC line is below the zero line, it indicates that trading volume is decreasing, which is often seen as a bearish signal. Traders can use this as a confirmation of a bearish trend, especially if other technical indicators are also indicating a downtrend.
- Confirming Reversals
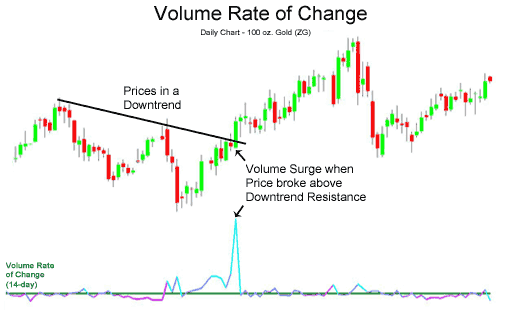
Remember, VROC can also be used to confirm potential trend reversals. For example, if a stock has been in a downtrend but the VROC line starts to rise and cross above the zero line, it could be a sign that the downtrend is losing momentum and a reversal is likely. Conversely, if a stock has been in an uptrend but the VROC line starts to fall and cross below the zero line, it could be a sign that the uptrend is losing momentum and a reversal is likely.
- Identifying Divergences
Another way to use VROC is to identify divergences between the VROC line and the price of the asset being analyzed. For example, if the price of a stock is making higher highs, but the VROC line is making lower highs, it could be a sign that the uptrend is losing momentum and a reversal is likely. Similarly, if the price is making lower lows, but the VROC line is making higher lows, it could be a sign that the downtrend is losing momentum and a reversal is likely in such times.
- Identifying Breakouts
Finally, VROC can also be used to identify breakouts. When the VROC line crosses above or below a certain level, it could be a sign that a breakout is likely. Traders can use this as a signal to enter or exit a trade, depending on whether they are bullish or bearish on the asset being analyzed.
Uses of VROC
While VROC can be a useful tool for identifying trends and potential trading opportunities, it is important to use it in conjunction with other technical indicators and fundamental analysis. Here are some uses of VROC in this section:
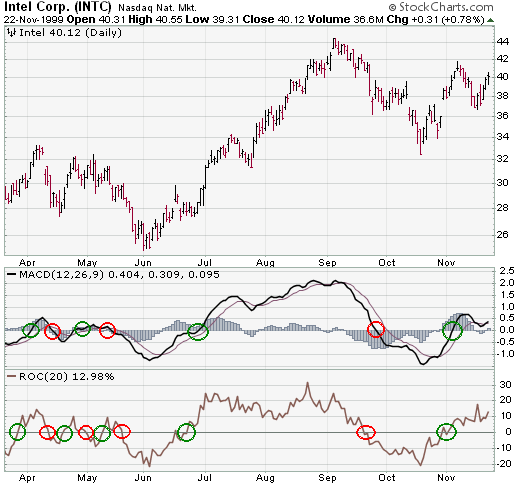
- Use VROC in conjunction with other technical indicators: VROC is just one of many technical indicators that traders and investors use to analyze the market. To get a more complete picture of market trends, it is important to use VROC in conjunction with other technical indicators such as moving averages, RSI, and MACD.
- Use VROC on multiple time frames: VROC can be used on multiple time frames, from intraday charts to weekly and monthly charts. By analyzing VROC on multiple time frames, traders can get a better understanding of long-term trends and potential trading opportunities.
- Use VROC in conjunction with fundamental analysis: While technical analysis is useful for identifying trends and potential trading opportunities, it is important to also consider fundamental factors such as earnings reports, company news, and macroeconomic events. By using VROC in conjunction with fundamental analysis, traders can make more informed trading decisions.
- Use VROC to confirm trends, not as a standalone indicator: VROC is a useful tool for confirming trends, but it should not be used as a standalone indicator. Traders should always consider other technical indicators and fundamental analyses before making trading decisions.
Common Mistakes with VROC:
While VROC can be a valuable tool in technical analysis, there are also some common mistakes that traders can make when using it. Here are a few of the most common mistakes to avoid:
Using VROC as a standalone indicator: One of the biggest mistakes traders can make when using VROC is to rely on it as a standalone indicator. While VROC can provide valuable insights into market trends and potential trading opportunities, it should always be used in conjunction with other technical indicators and fundamental analysis.
Failing to adjust for different time frames: Another common mistake is failing to adjust VROC for different time frames. VROC can be used on intraday charts, as well as weekly and monthly charts. However, the rate of change in trading volume may look different in different time frames. Traders should always adjust VROC for the time frame they are analyzing.
Failing to consider fundamental factors: Another mistake traders can make is to rely solely on technical analysis and ignore fundamental factors. While VROC can provide valuable insights into market trends, it is important to also consider factors such as earnings reports, company news, and macroeconomic events.
Failing to consider transaction costs: Finally, traders can also make the mistake of failing to consider transaction costs when using VROC. If a trader enters and exits a position based on VROC signals, they may incur transaction costs that can eat into their profits. It is important to consider transaction costs when making trading decisions based on VROC signals.
Conclusion
The volume rate of change, or VROC, the indicator is one of the most widely used technical indicators for measuring trade volume changes. The focus on volatility offers traders a sense of the market’s current momentum and activity, which is more than a trader can get from a simple daily volume bar chart.
VROC can be used in conjunction with other technical indicators and fundamental analysis to confirm trends, identify potential reversals and breakouts, and make informed trading decisions.
However, it is important to use VROC in conjunction with other tools and to always consider fundamental factors when making trading decisions.


