
Risk management can help traders make money in the long run. However, there are some risk management concepts that every trader needs to know.
These concepts include drawdown and maximum drawdown. Besides being essential, they also ensure that your trading account stays healthy.
In this article, we shall cover drawdown and maximum drawdown in detail, along with ways you can deploy them to your advantage.
What is Drawdown in Trading?
A drawdown in trading is the drop in one’s capital after a chain of losing trades. It is a peak-to-trough decline over a specific period. If a trader’s equity isn’t all-time high, they are in a drawdown. It is usually expressed as a percentage.
The drawdown is vital for monitoring personal trading conduct, comparing fund performance, or measuring the historical risk of various investments.
A lot of times, the drawdown is insignificant and nothing big to get worried about, however, when it becomes a double-digit number, the drawdown can be significant in future returns.
Example of Drawdown
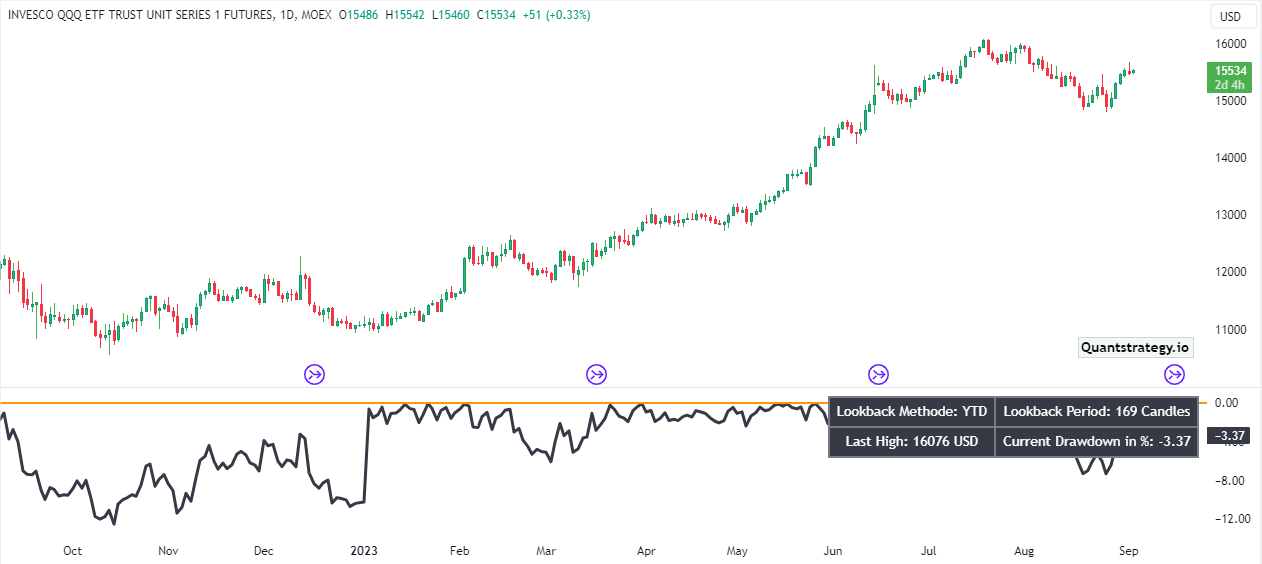
Above is an example of a drawdown in ETF QQQ. While the first pane denotes the price of QQQ, the pane’s red color below demonstrates the drawdown percentage in the latest peak of QQQ. The drawdown in the above example shows that QQQ established a new high in late February 2020 before it dropped to a 27% drawdown in March. But it quickly established a new high in June again.
The drawdown can be lengthy. The 27% drawdown in March 2020 is very small relative to what happened in 2000.
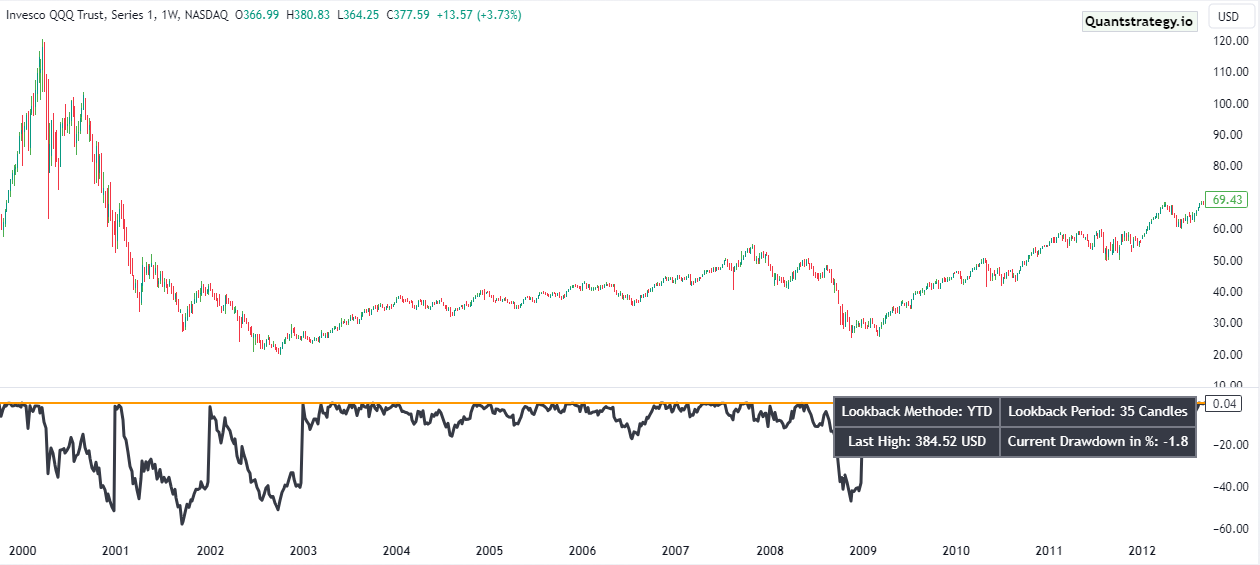
The drawdown did not end till 2015. 15 years is quite a long period for a drawdown to recoup. The maximum drawdown in this time was in late 2002, which was a robust 83%. This means 100,000 invested at the peak only worthed 17,000 after two years.
Most investors and traders would be completely shattered by such a disastrous performance. One needs strong poise to stay consistent after such an adverse performance.
Calculating a Drawdown
Let us assume that an investment or trading account has 95000$ today, but it declines to 85000$ over the next two months, before moving back above 95000$, then the account experienced a 10000$ drawdown.
Since drawdowns are better expressed in percentages, a 10000 drawdown is 10.5% of the 95000 peak.
Hence the drawdown, in this case, is 10.5%.
Drawdowns end when the account sets a new peak above 95000, and the process begins again.
Drawdown Further Explained
Drawdowns hold good as long as the price stays below the peak. In the example above, we do not know the drawdown is only 10.5% till the account moves back above 95000$. Once the account moves back above 95000$, then the drawdown got recorded.
This method of noting drawdowns is useful as a trough cannot be measured till a new peak is formed. As long as the value or price stays below the previous peak, a lower trough can be formed that would surge the amount of drawdown.
The total volatility of a stock is commonly measured by its standard deviation, yet many investors, including retirees that withdraw funds from retirement accounts, are generally concerned about drawdowns instead. Large drawdowns and volatile markets can be tricky for retirees and mutual funds. Many of them observe their investment drawdowns and consider maximum drawdowns to avoid those investments with the largest historical drawdowns.
What is a Maximum Drawdown in Trading?
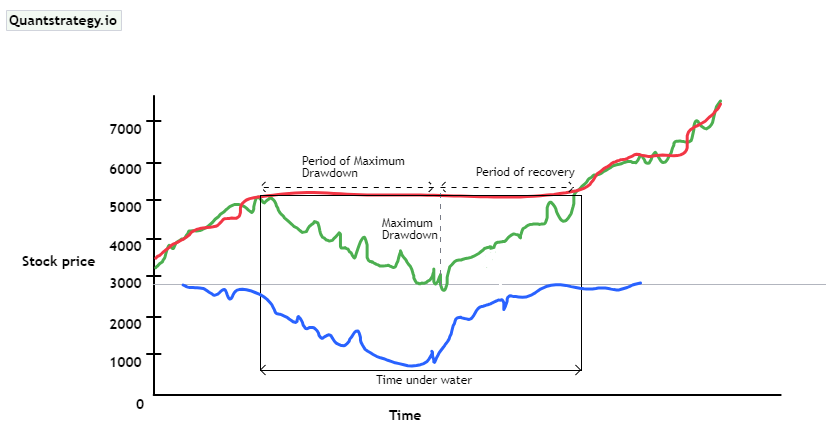
A maximum drawdown (MDD) measures the maximum decline from a peak to a trough of investment before a new peak is achieved. MDD is an indicator of downside risk observed over a certain period.
It is calculated over a long time when the value of a trading system, investment portfolio or asset has been through numerous boom-bust cycles. It’s calculated as:
It can be utilized as a stand-alone measure as well as an input for other metrics like the Calmar Ratio and Return over Maximum Drawdown. MDD is also expressed in percentage.
The formula for MDD is
Maximum Drawdown = Trough Value – Peak Value / Peak Value
Example of Max Drawdown
Let us assume a trader has 100,000$ in his trading account. He can go down to 95000$ before getting disqualified. He is a profitable trader and makes 4,000$ in the account. His High-Water Mark is 104,000$ now. So, his max drawdown limit will be 99,000$. He then makes an additional 1000$ in the account. So his new High-Water Mark is 105,000$. This is where it’ll lock in where the high High-Water Mark rises, his max drawdown limit will remain at 100,000$, which means his MDD rises beyond 5%.
Let us assume a trader grows his account to 120,000$. His effective MDD level is now 20% (4 times greater).
Maximum Drawdown Further Explained
Max drawdown is a distinct measure of drawdown, which detects the greatest movement from the highest peak to the lowest peak before a new peak is attained. But it’s noteworthy that MDD measures the size of the biggest loss only and doesn’t take into account the frequency of big losses. Since it measures only the biggest drawdown, the max drawdown doesn’t specify how long the investor took to recoup from the loss or if the investment even recouped at all.
By calculating the difference between the highest and lowest trough values of an asset, MDD illustrates the volatility of its value that occurred in the past and provides a nearly accurate way of anticipating future price actions.
A low max drawdown value signals small fluctuations in the investment value and hence a lesser level of risk and vice versa. When comparing two investment choices, a trader who wants the guarantee of steady returns would probably choose the choice with the lower maximum drawdown risk. On the contrary, another trader who wishes to take a bigger risk in return for a larger return would likely opt for assets with higher max drawdown values.
Besides this, MDD also serves as an indicator of market performance. An asset’s MDD can be compared with that of a stock market index to assess the performance of the asset compared to the market. If the max drawdown of an individual stock is less relative to its benchmark index, this interprets that the former surpassed the index, even if the max drawdown value of the stock is high appreciably.
For instance, the max drawdown of Tata Motors is high at -40% over a specific time, and that of its benchmark index is -50% (Nifty). The Tata Motors stock performed much better than the market, even with a high absolute value.
Drawdowns are Normal in Trading
The essential part of being a successful trader is to come up with a trading plan, which enables you to resist these times of large losses. And a component of your trading plan is keeping risk management rules at hand.
Consider the example of a poker player who goes through a series of losing streaks but still stays profitable ultimately because they have a winning plan in place. Besides that, they do not risk their whole bankroll on one tournament or session.
The same applies to trading with the market. You’ll have a losing streak even if you’re consistently profitable. It is part of the process. Just ensure you’ve sufficient capital and you are not risking a large percentage of your bankroll to survive those losing streaks.
Moreover, it is noteworthy that if a trader’s account undergoes drawdown losses, it isn’t necessarily an indication of a poor strategy. Risks are always associated with trading the market. The important part is to understand those risks and adopt a well-prepared trading strategy to decrease them.
Conclusion
The max drawdown in trading is crucial since it has a significant impact on how you compound in the long run. A drawdown has the power to either make you abandon the ship or seriously impair your performance. Make sure you know why your trading techniques succeed since how you respond to drawdown matters.
The smallest drawdown percentage is ideal. You should be aware of how you would respond if you experienced a drawdown that reaches 20-25e because most traders cease trading when it hits such a magnitude. A drawdown in trading is crucial for this reason.