

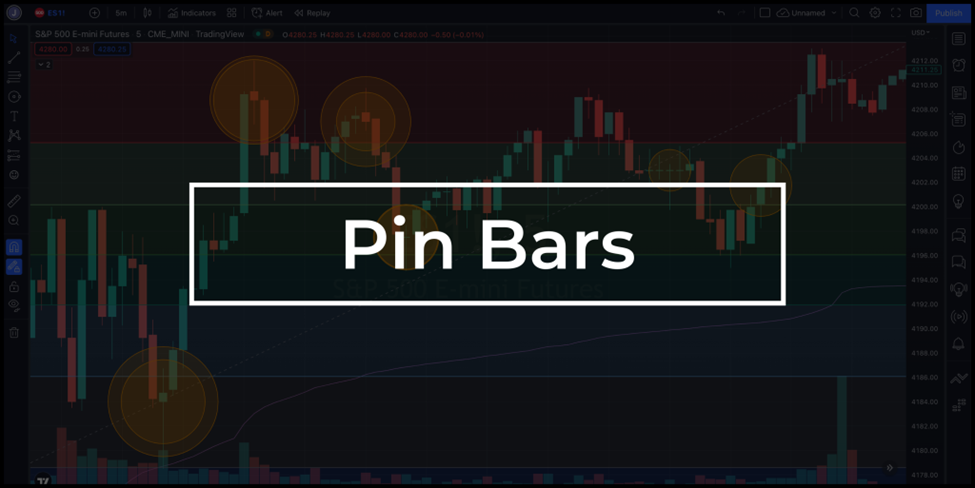
Pin bars are powerful single candlestick patterns used frequently for reversal pattern trading in all financial markets. The pattern is not just about identifying a pin-like appearance on your charts – it is an important tool that, with its visually distinctive shape emerging at key support and resistance levels, serves as early warning signals for an imminent reversal.
This guide will provide an in-depth pin bar understanding and will show how to trade pin bars for consistent profits.
Let us begin!
The Magic of a Single Candlestick Pattern
Technical analysis has fundamentally transformed since the Japanese brought the candlestick chart patterns to the West. Japanese candlesticks offer traders an easier way to understand the price movement in a period.
Bar charts were the standard option before that. But even while they display the opening and closing values, they don’t have the same level of detail as Japanese candlesticks.
Japanese candlestick techniques are very different from the traditional pattern recognition method that was used at the time. It’s well known that Japanese patterns are at least as effective and require less time than other techniques.
Many of the patterns were completely unexpected in the Western world. A few examples include the Doji candles, bullish and bearish engulfing, and morning and evening stars.
However, the Western technique was already aware of one pattern – The Pin Bar Candlestick Pattern. It is a single-bar pattern that has been around since the early days of technical analysis.
Forex traders prefer to view a market using a candlestick chart pattern nowadays. The pin bar thus evolved into a single candle, but the trading premise remains the same.
But what makes a pin bar pattern?
Decoding Pin Bars – What Makes Them?
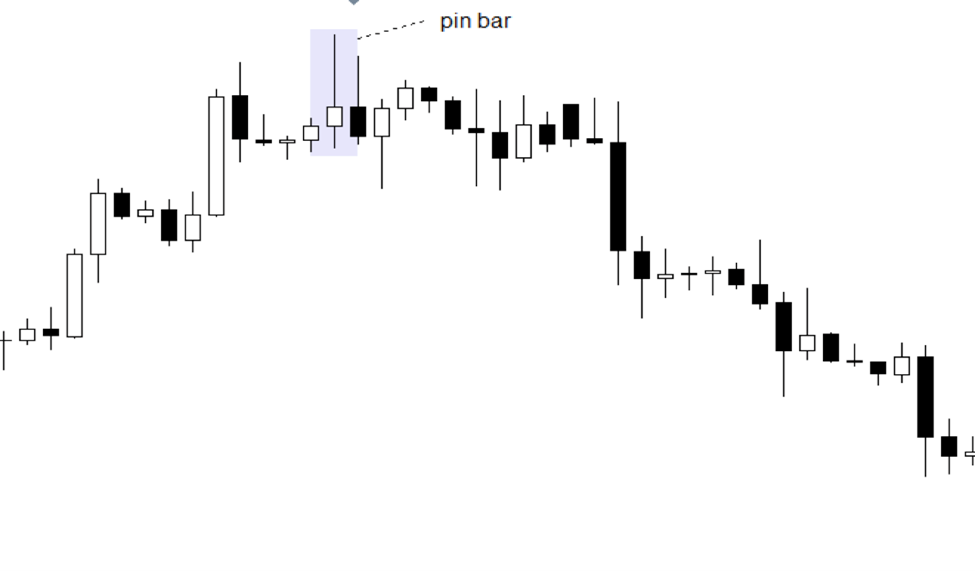
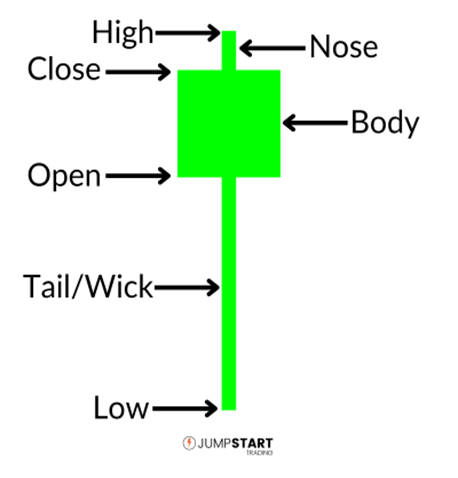
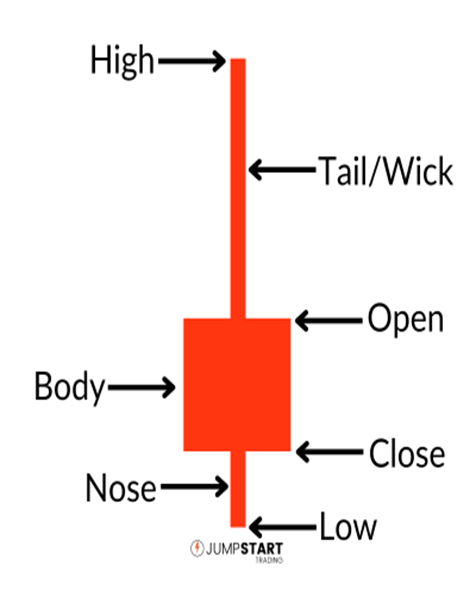
A pin bar is a candlestick pattern that demonstrates a rejection of price and sharp reversal. It has a small body and a long wick or tail. What sets it apart is the prolonged tail that exceeds the surrounding price movement and gives it the appearance of a pin. A pin bar pattern generally features small real bodies compared to their long tails.
It’s interesting to note that the pin bar stands for Pinocchio Bar. Expert technical analyst, Martin J. Pring, was the first to identify the pattern as a pin bar.
Technically, the long wick also called the pin bar tail, indicates that the market has overreacted and that the trend will possibly change its direction, while the small body of the pin bar formation suggests a weakening of the existing trend.
Hence, you will quickly understand the entire notion of the pin bar when you think of it as a Pinocchio. The long wick and small body have ‘lied’ to us, resulting in a long tail, similar to Pinocchio’s nose.
Key Features
- Tail indicates rejection of an extreme price level
- Long tail extending past body horizontally
- Small genuine body at one extremity of the candle range
A pin bar forms at areas where prices have been driven too high and were quickly rejected by new buyers or sellers. This could occur at trendline borders or previously defined support and resistance zones.
Traders can find pin bars with any timeframe, on any financial chart, and is usually considered a reversal pattern.
Why Are Pin Bars Important?
The importance of pin bar formations comes from their ability to indicate an impending reversal. Imagine that a bearish pin bar in an upward trend could indicate a change toward a downward trend. On the other hand, a bullish pin bar in a downward trend can indicate an approaching upward trend. This pattern indicates potential trend shifts, much like a compass.
Bullish Pin Bar – A Positive Signal
Picture a candle with a long lower tail that extends past the most recent price action, with the opening and closing prices close to the top of the candle’s range. This pattern serves as a bullish pin bar. It signals a possible reversal from a downward trend to an uptrend. This chart pattern indicates that buyers have regained control following a brief price decline, and the closing price is near the opening, forming a small body.
Bearish Pin Bar – A Negative Signal
Now imagine the opening and closing prices close to the bottom of the candle’s range, with a long upper tail (could be three or more times longer than the size of the body) that extends beyond recent price highs. This pattern serves as a bearish pin bar, signaling a possible change from an upward trend to a downward trend. The long upper tail of the pin means that sellers interfered when buyers tried to drive prices higher, resulting in the price closing near the low of the candle.
Types of Pin Bars
You can trade a number of different pin bar formations. Each holds unique characteristics and signals and contributes to your trading strategy. Here is a quick breakdown of four distinct types.
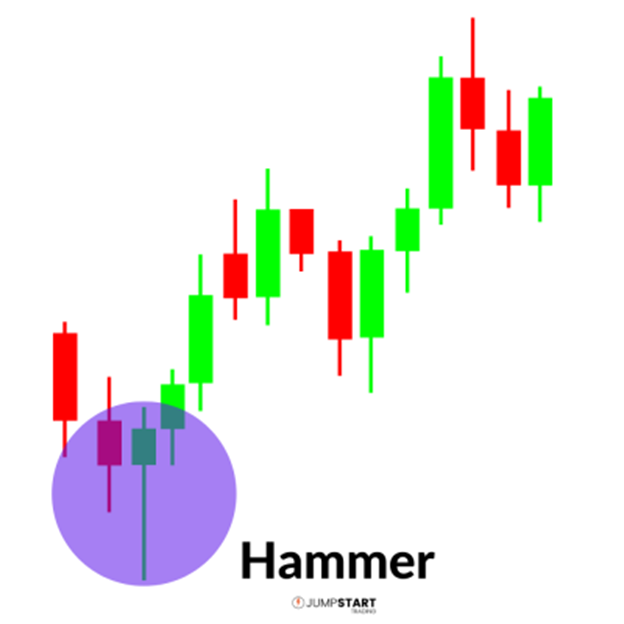
Hammer
The hammer is a bullish reversal pin bar that occurs at the end of a price drop (downward trend). At the beginning of the session, sellers were in charge, but toward the end, buyers took over and drove prices near the highs. The outcome is a candle with a long lower wick or tail that will extend beneath the most recent price movement.
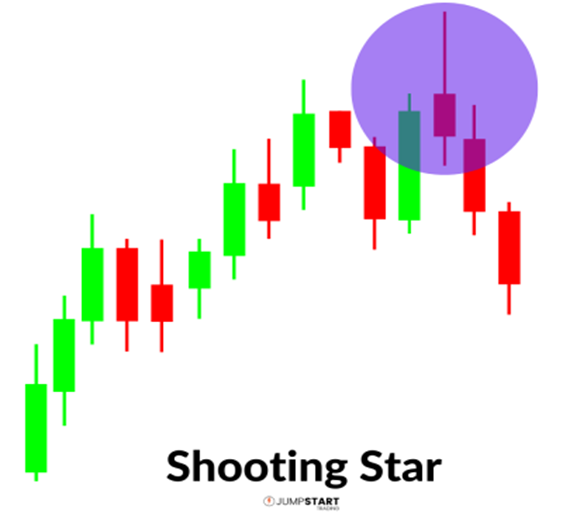
Shooting Star
The shooting star is a bearish pin bar pattern that occurs at the end of the price rise (upward trend). At the start of the session, buyers were in charge, but toward the end, sellers took control and pushed the price back below the candle’s open. The outcome will be a candlestick with a long upper tail, or wick, that rises above the recent price movement.
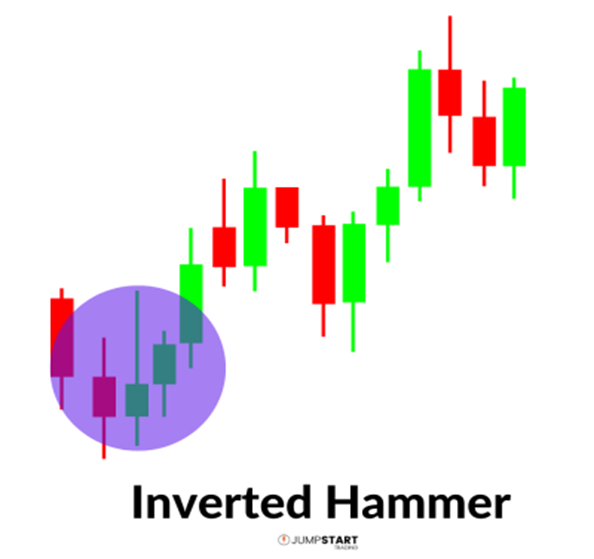
Inverted Hammer
The inverted hammer resembles a shooting star but develops following a downward price trend. The long upper wick indicates a possible reversal as buyers started to act aggressively but surrendered some ground back to the sellers before closing of the candle.
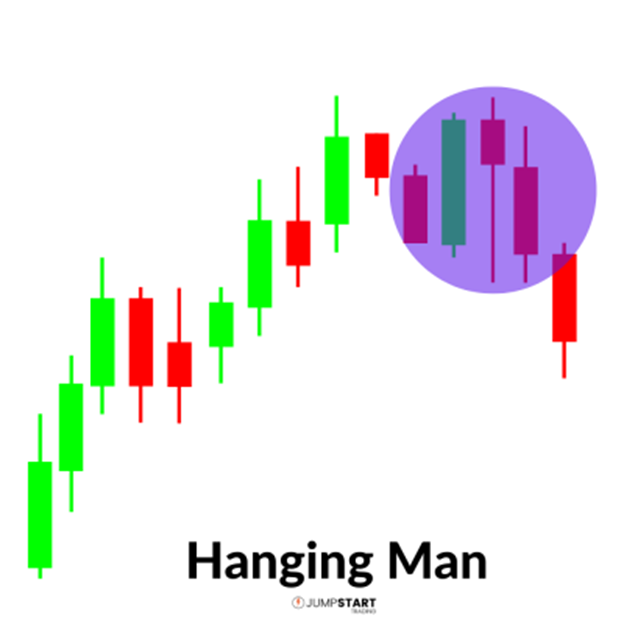
Hanging Man
The hanging man resembles a hammer but develops at the end of an uptrend. The long lower tail indicates that sellers were dominant at the beginning of the session but buyers gained the ground before the close.
Identifying and Trading Pin Bars
A pin bar setup can be seen across various timeframes and markets. Identifying a pin bar candlestick pattern is fairly simple. Focus on three key elements:
- Tail size of the Pin Bar Formation: The pattern should entail a long tail or wick that extends beyond the body of the candle. The tail size should be at least three or more times the height of the main body area of the candle to be considered a standard pin bar for greatest probability setups.
- Shadows vs Wicks: It is also common to refer to the key tail part as shadow or wick interchangeably. Just make notice of which wick or shadow stands out more, the upper or lower.
- Recognizing Bearish and Bullish Pin Bar Patterns: Pin bars with a long lower tail at a key support level indicate bullish rejection; the buyers withdrew as the bears attempted to drive the price lower. These bottom pin bars, which resemble hammers, have upside potential. On the other hand, pin bars at resistance with a lengthy upper tail indicate sellers’ bearish rejection; the higher attempt was quickly rejected, signaling a return to the downside.
Common Mistakes in Recognizing Bullish and Bearish Pin Bars
Not every pin bar formation works out effectively. An invalid formation with insufficient tail size compared to the candle body is possibly a false indication. Even a valid pin may end up pulled out if no actual market reversal occurred and the pin bar makes a continuation pattern in the current direction instead.
Use careful risk management because pin bars are not a certain but a probabilistic pattern. Consider making even further confirmation and analyzing market conditions as part of your pin bar strategy.
How to Trade the Pin Bar Candlestick Pattern
As mentioned earlier, pin bar trading is simple. Successful traders ensure to check the following steps in the pin bar formation before they begin trading.
- Examine the Tail: A powerful reversal signal appears in the opposite direction of the tail. The tail stretches below the body in a bullish configuration and above in a bearish configuration.
- Context Is Important: Fibonacci levels, trend lines, and critical support/resistance levels are where pin bars are most effective. These regions increase the pattern’s dependability.
- Assess Volume: Although it’s not required, volume can provide further assurance when a pin bar pattern appears. The validity of the pattern is strengthened by increased volume.
- Obtain Confirmation: Use divergence indications, price action patterns, or technical indicators, like the Relative Strength Index and Stochastics to improve pin bar signals.
Pin Bar Trading Strategies
After you have learned how to spot a high probability pin bar setup, the next step is the execution – to enter pin bar reversal trades at the correct time.
Entry Techniques
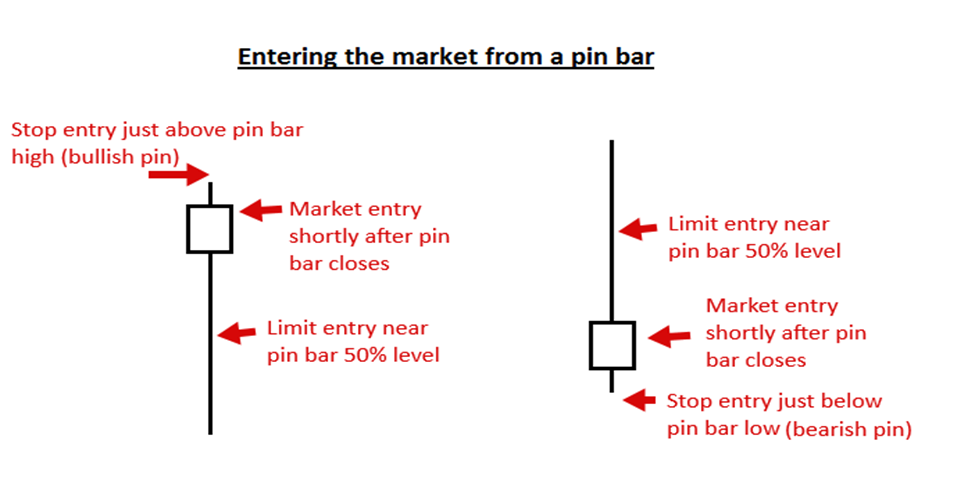
There are several methods to choose from when trading pin bar reversals. Some of the most common are:
- Entering the pin bar trade at the current market price. Keep in mind that the pin bar pattern should be closed out before you enter the market according to it. The bar is not truly a pin bar until it is closed as a pin bar pattern.
- Entering on the 50% retrace of the pin bars. This means you would hold off on placing a limit entry order until the price had retraced to about the “50% level,” or the middle point of the pin bar’s range from high to low.
- Enter by placing an “on-stop” entry just below or above the pin bar’s high or low.
Here’s an illustration of how the several pin bar entry possibilities can appear:
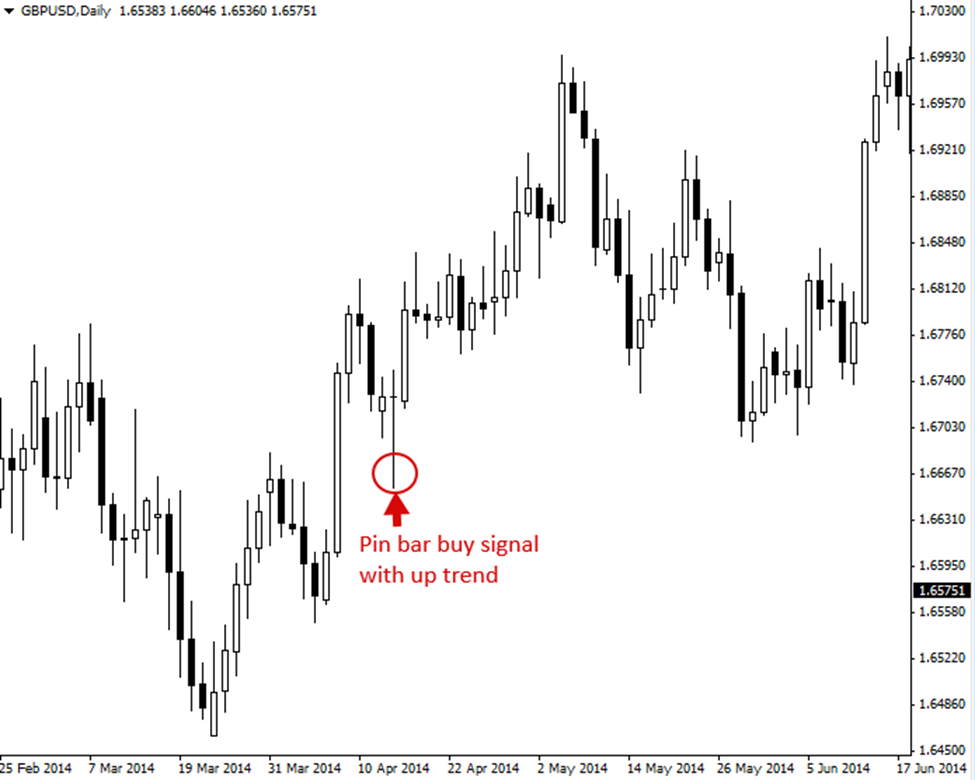
Trading With the Trend
The best trading strategy to trade any market is probably to follow the trend. In a trending market, a pin bar entry signal can provide a high probability entry and a favorable risk-reward ratio.
A bullish pin bar indication that developed in the course of an upward-trending market is seen in the image below. This kind of pin bar reflects a rejection of reduced prices (see the long lower tail) and implies that the bulls will begin driving prices higher, hence, it is termed a bullish pin bar.
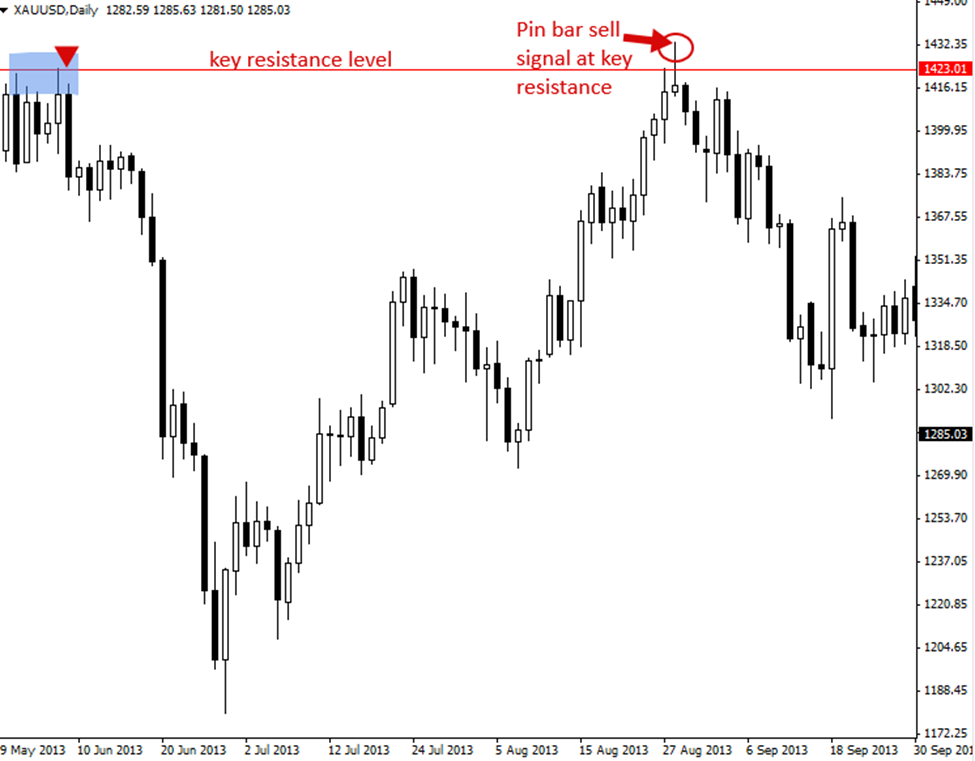
Trading Against the Trend
It is generally agreed upon that a trader should trade a pin bar counter to, or against, a prevailing trend from a key chart level of support or resistance. The key levels provide more weight to the pin bar as they do in a counter-trend inside bar pattern. A key level to keep an eye out for pin bar reversals is whenever you notice a moment in the market where the price starts a sizable move, either up or down.
Pin Bar Combo Patterns
When a pin bar forms exactly next to another candlestick pattern, it is referred to as the pin bar combo pattern. The below chart depicts an inside bar within the pin bar. The pin bar is actually the mother bar of the inside bar pattern.
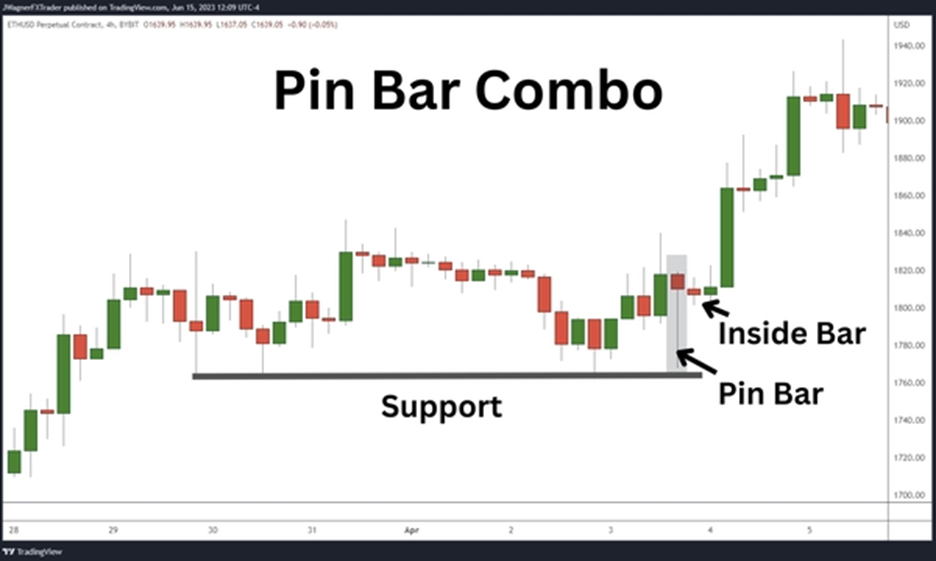
As we can see above, the price of Ethereum is pressing downward, and the pin bar’s low point is in line with a key price level. An inside bar forms after the pin bar. The pin bar and inner bar combination signals a possible reversal, with an upward price movement anticipated after the price attempts to bottom. A couple of candles later, the price makes a higher, upward break.
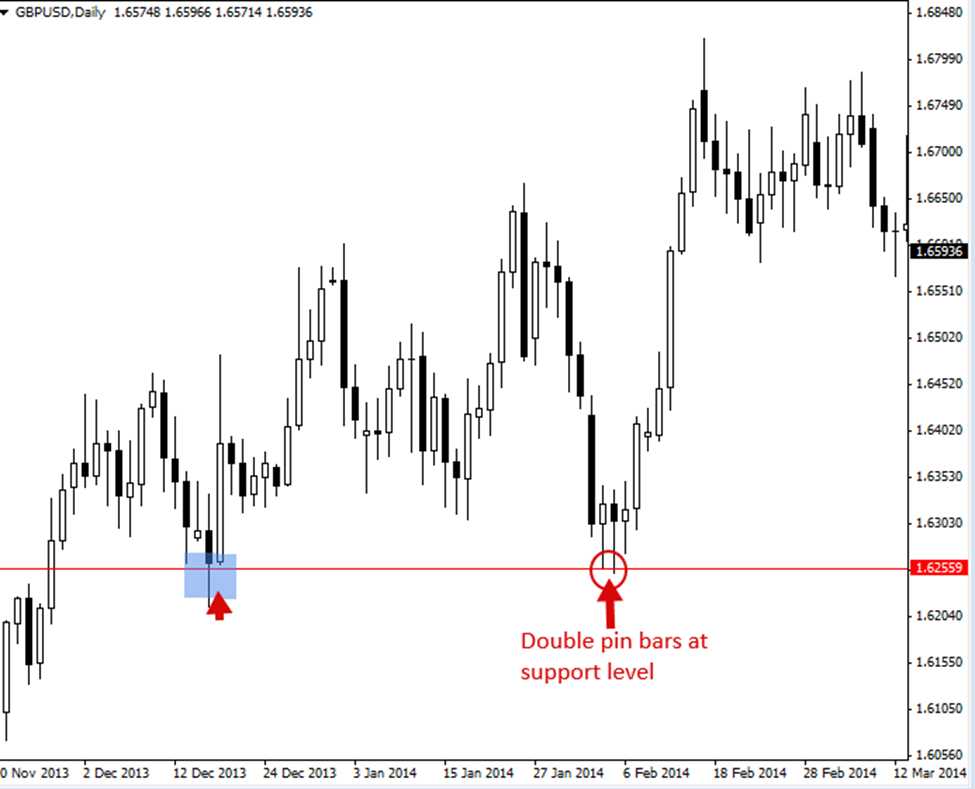
Double Pin Bar Patterns
Seeing consecutive or “double pin bar patterns” from key market levels is not unusual. They are traded like a typical pin bar, but because they show two straight rejections of a level, they offer traders a little more “confirmation.”
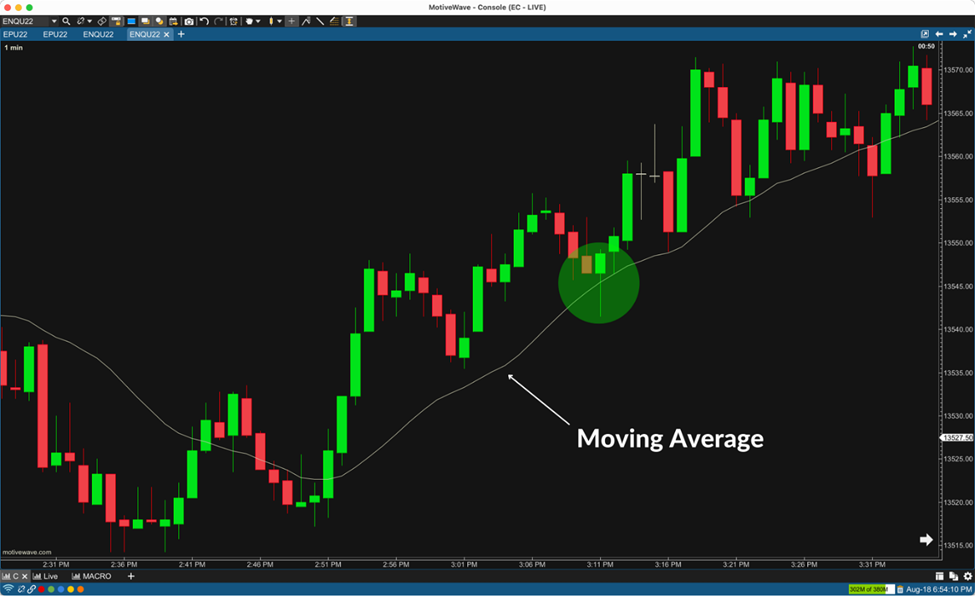
Moving Average Bounce
Another trading strategy for a pin bar is to couple it with your preferred Moving Average (MA) and wait for a potent trend. Look to play a pin bar bounce off the MA once you’ve established a solid trend.
Advantages and Disadvantages of Trading Pin Bar Patterns
Advantages
- Since they are single candlestick patterns, they are relatively simple to identify.
- They give reliable signals for trend reversals.
- Good risk-reward ratio
Disadvantages
- They are less effective in a lower time frame.
- The pattern can indicate both the reversal or continuation of a trend, rendering it confusing and challenging to take positions.
- They are less effective in range-bound markets.
Conclusion
The pin bar pattern provides a framework for identifying trading opportunities based on current market psychology and price action dynamics. Whether you’re a novice trader or an experienced professional, integrating pin bar analysis into your trading approach can contribute to improved decision-making and enhanced profitability in the financial markets.


