

Bollinger Bands are a powerful technical analysis tool used by investors and traders to measure market volatility, spot possible trends, and produce trading signals. Bollinger Bands, which were created by John Bollinger in the 1980s, are frequently used to analyze a variety of financial instruments, such as currencies, commodities, and stocks.
The bands encapsulate a security’s price movement by creating relative highs and lows. The crux of the Bollinger Band relies on a moving average, which, depending on the time frame you are looking at, defines the intermediate-term “trend”.
They are easily found on trading platforms, but how do we apply them to trading and maximize gains?
In this post, we’ll cover the fundamentals of Bollinger Bands and look at several common approaches to using Bollinger Bands to make trading decisions. Understanding Bollinger Bands can enable you to enhance your trading techniques and raise your chances of market success, whether you are a novice or a seasoned trader.
What are Bollinger Bands?
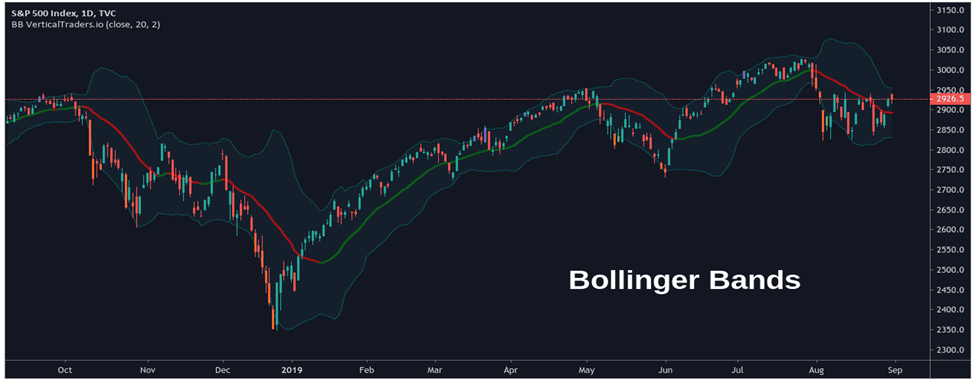
Bollinger Bands are a standard and reliable indicator that is employed by many traders to understand the price volatility of a certain financial instrument. As the name suggests, a Bollinger Band refers to a band (price channel) shown on a price chart to represent the volatility range in which the price of a specific security goes up and down. This technical indicator was named after its developer, John Bollinger, a renowned technical analyst, who developed it in the 1980s.
The idea behind Bollinger bands is derived from standard deviation, a statistical measurement or unit that assesses the distributional pattern of any data. It contains roughly 68% of the total number of data points for the normal distribution pattern. Nearly 95% of the data points are contained within two standard deviations.
Components of Bollinger Bands
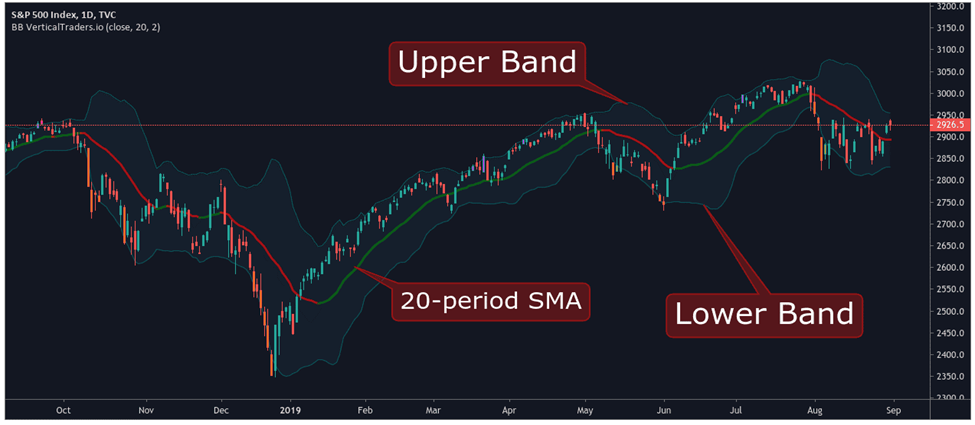
The three components of a Bollinger Band indicator are:
- Middle Band: 20-period simple moving average (SMA).
- Upper Band: Positioned a specific number of standard deviations above the middle band in a price range.
- Lower Band: Positioned below the middle band by a predetermined number of standard deviations of a price.
There are two parameters that traders can select from when using Bollinger Bands:
- Period – This is the period deployed in SMA, and the default value is 20.
- Standard Deviation – this parameter is the multiplier of the standard deviation, that shows how widely prices deviate from the average. Although it can be changed depending on the technique, the standard deviation’s default value is 2.
The layout of your broker will determine how to set up Bollinger Bands on trading platforms. Normally, traders may select from a variety of technical indicators on a toolbar, and Bollinger Bands would be shown there.
Moreover, there are a few key points to remember when analyzing a Bollinger Band:
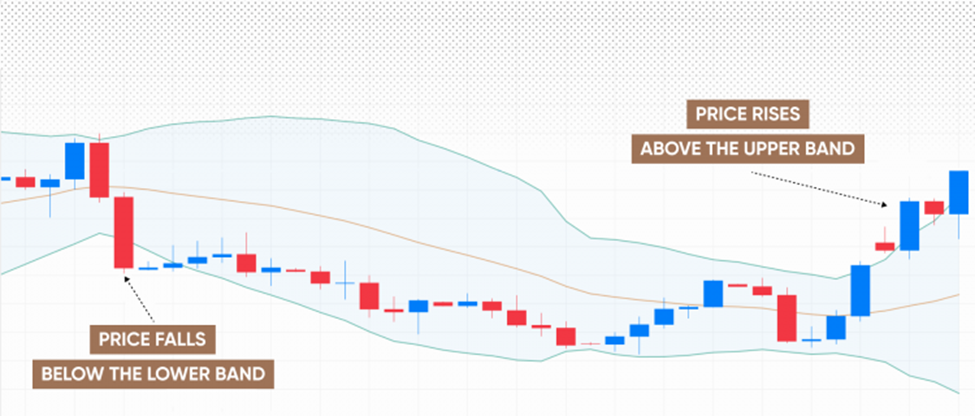
- Price movements outside the band’s envelope are typically not long-lasting.
- Contraction implies low price volatility, while expansion reflects high price volatility.
- Price action above the upper band signals overbought markets (and vice versa).
- Nearly 95% of all price action takes place between upper and lower boundaries.
How to use Bollinger Bands Indicator in Trading?
Since the upper and lower bands are representations of standard deviation, it may be inferred that they’re based on price volatility. When the bands contract and lay close together, a period of low volatility is indicated.
On the other hand, a rise in market volatility or price action is observed when the space between the bands expands. Price will typically be seen to fluctuate between the bands like they’re in a channel if the bands start to develop a tiny slope and track practically parallel for an extended length of time. The bands, which are determined by standard deviation, also pinpoint potential support and resistance levels.
The fundamental premise behind the Bollinger Bands trading strategy is that a trader may assess whether an asset’s price is generally high or low by evaluating the asset’s position about the bands.
If an asset price continuously touches the upper Bollinger Band, it’s thought to be overbought. On the contrary, if it constantly touches the lower Bollinger Band, it’s considered to be oversold.
The bands also function as resistance or support levels.
Besides, Bollinger Bands are used by traders in a variety of ways, such as spotting possible trend reversals or establishing stop-loss and take-profit levels. The performance of a Bollinger Band ultimately relies on the trader’s personal trading strategy and the particular market circumstances they are dealing with.
Bollinger Band tags (or touches) of the lower or upper bands are neither buy or sell signals in and of themselves, thus, traders should use them in conjunction with other indicators, chart patterns, and more to make sound trading choices.
Bollinger Bands Strategies
The Bollinger Band is a powerful indicator, which provides numerous trading signals to traders in the market. Trading with it would vary depending on your trading style and objectives. Below are some techniques traders could consider while trading with them.
Overbought & Oversold Strategy
This Bollinger Bands strategy is based upon the mean reversion of the price. If a price considerably diverges from the mean, mean reversion predicts that it will eventually return to the mean price.
Bollinger Bands, as we already know, spot asset prices that have diverged from the mean. Therefore, a trader following this approach would think about opening a long position when the asset’s price breaks below the lower band in an attempt to get the price to return to the SMA band.
On the other hand, if the price breaks over the upper band, the investor employing this approach can think about entering a short position and wagering on a return to the middle band.
Bollinger Band Squeeze Strategy
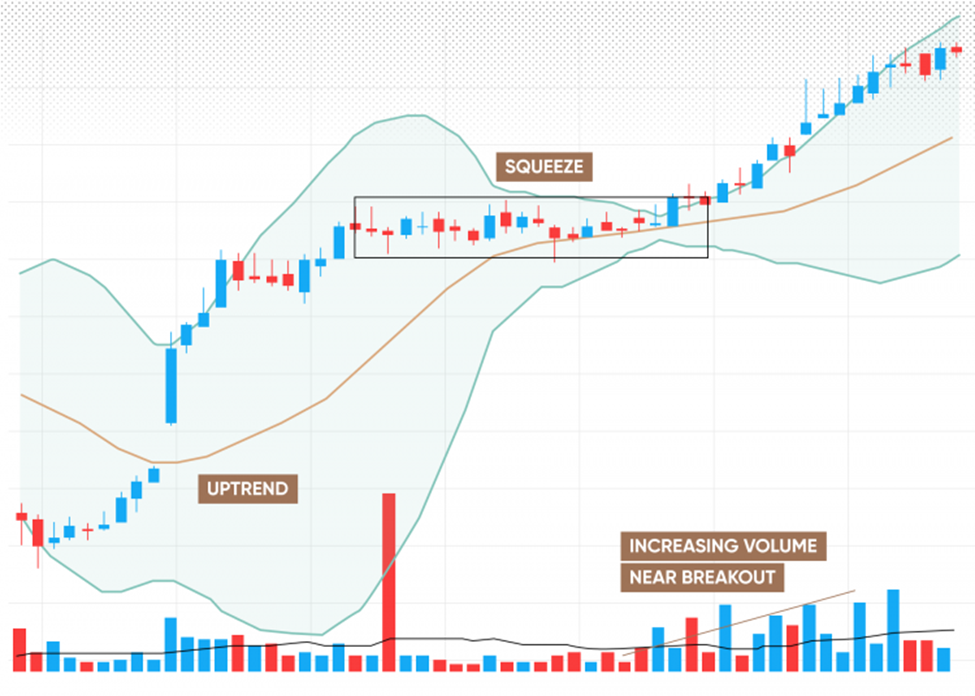
Bollinger Bands Squeeze is another Bollinger Band strategy that refers to a trading range that is getting smaller and suggests a breakout is about to happen.
It occurs when the price moves rapidly and then abruptly begins to move sideways in a close consolidation. When an asset’s price is consolidating, a trader can see it on the chart because the lower and upper bars are getting closer together. It denotes a reduction in the asset’s volatility.
Following a period of consolidation, prices typically move more significantly in either direction, preferably on high volume. But keep in mind that this is just based on looking at historical results, so there’s no assurance that future returns will be profitable.
A breakout’s expanding volume indicates that traders are betting that the price will keep moving in the breakout direction. The trader either sells or buys the asset when the price breaks through the lower or upper band. Traditionally, a stop-loss order is placed on the side of the breakout that is opposite the consolidation.
Keep in mind that a standard stop-loss order won’t prevent slippage. Traders can acquire a guaranteed stop-loss for a price, which prevents slippage.
Double Bollinger Bands Strategy
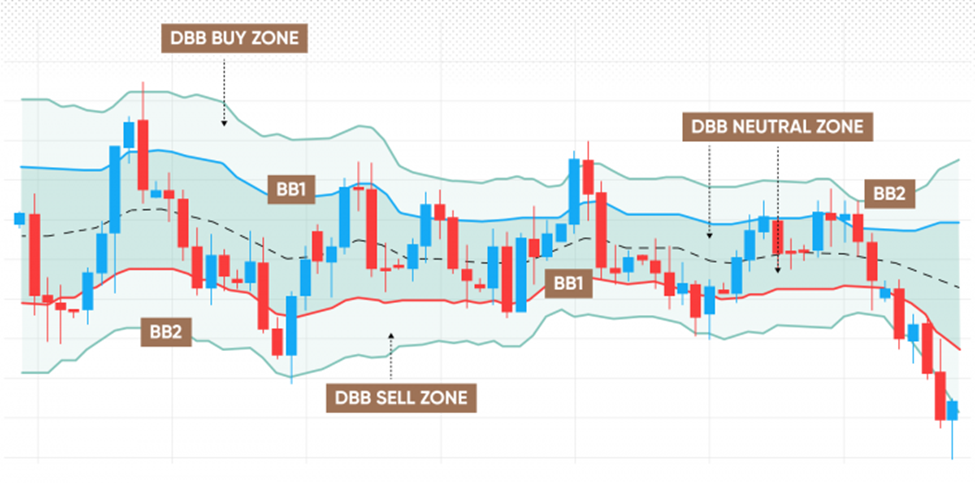
Traders using this trading approach use two sets of Bollinger Bands. The first one uses a standard deviation of 1 (BB1) and is set to a period of 20. The second Bollinger Band uses a standard deviation of 2 (BB2) and is set to a period of 20. The concept is that the wider Bollinger Band, with a standard deviation of 2, will detect the big trend moves, and the narrower Bollinger Band, with a standard deviation of 1, will assist in filtering out false signals and offer confirmation of trend changes.
The Buy Zone will be the region between BB1 and BB2 upper bounds, while the Sell Zone will be the region between BB1 and BB2 lower bounds. The Neutral Zone is the region that lies between the upper and lower borders of BB1.
Double Bollinger Bands traders have the option of trading breakouts or following the trend. They would keep an eye out for a strong shoot into the Buy Zone or Sell Zone and open a long or short position accordingly. In a neutral market, traders can watch for breakouts or wait for a trend to develop. It’s crucial to verify entries with additional technical analysis tools.
Conjunction with RSI Strategy
Bollinger Bands indicator makes it easier to find value zones on your chart, but it has a flaw in that it doesn’t tell you how strongly the bands are moving.
For instance, how can you anticipate whether the market will mean revert or continue to trade beyond the outer bands?
Relative Strength Index (RSI) is crucial in this situation. It allows the trader to determine the momentum by measuring the number of days the stock closes up versus down. Additionally, it is shown as a number between 0 and 100.
When the RSI indicator shows a value above 70, it’s considered an overbought security. Likewise, a value below 30 denotes oversold securities.
When the market strikes a higher high, but the RSI depicts a lower high, it indicates weakness and is referred to as a bearish divergence. Conversely, when the market strikes a lower low, but the RSI depicts a higher low, it indicates strength and is referred to as a bullish divergence.
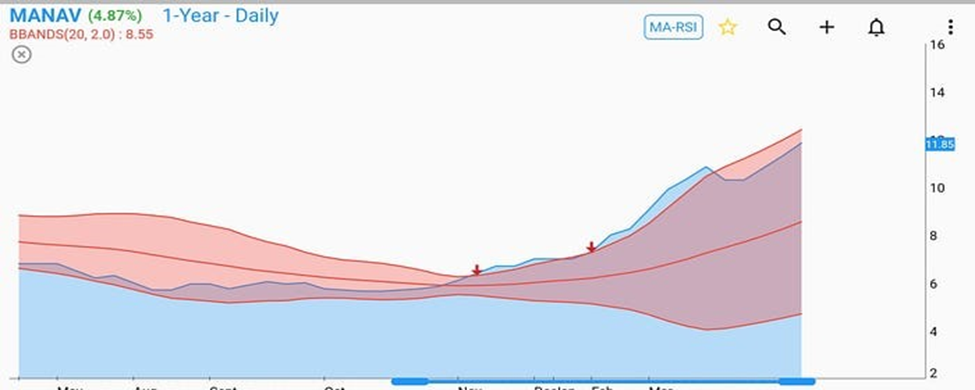
Thus, the question is: How do Bollinger Bands and RSI divergence interact?
Look for a bearish RSI divergence to indicate weakness in the underlying move if the price is higher than the upper Bollinger Bands. Conversely, watch for a bullish RSI divergence to signify strength in the underlying move if the price is moving close to the lower Bollinger Bands.
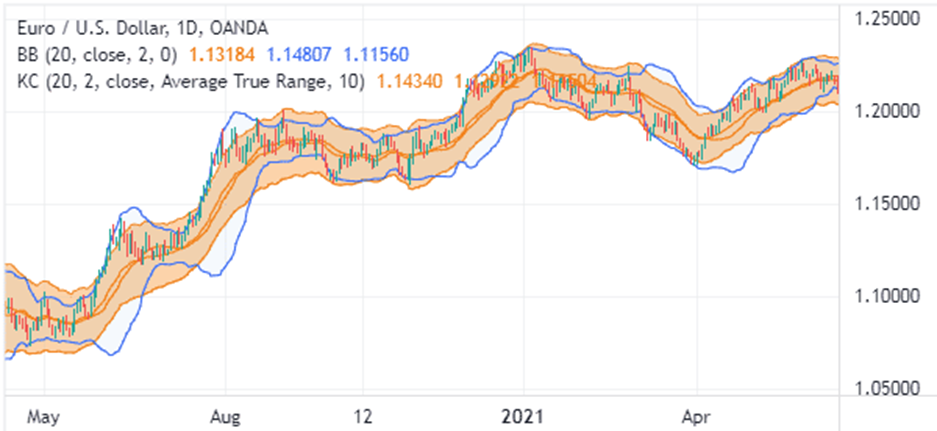
Bollinger Bands VS Keltner Channels
Bollinger Bands are frequently mistaken for Keltner Channel due to their similarity. In fact, it is often challenging to distinguish between the two indicators when they are used in a chart.
The two are different in that Bollinger Bands employs standard deviation while Keltner Channels uses the Average True Range (ATR).
Both are used in the same manner in trading. The EURUSD with Keltner Channels and BB is displayed in the chart below.
Pros & Cons
Bollinger Bands indicator has some advantages and disadvantages, which are as follows:
Pros
- Simple to utilize: Traders of all skill levels can use Bollinger Bands since they are simple to understand.
- Offers a straightforward visual illustration of price action: It can be used by traders to spot market patterns, volatility, and possible reversals.
- Pairing with other indicators: Bollinger Bands can be used along with other technical indicators to verify trading signals.
- Popular: Most charting platforms feature Bollinger Bands and are commonly used by traders.
Cons
- Not always reliable: Like any technical indicator, Bollinger Bands can generate false indications and are not always reliable. It is also crucial to remember that band tags (or touches) are not signals in and of themselves.
- Lagging indicator: It is a lagging indicator and may not offer timely signals for rapidly changing markets.
- Can be arbitrary: Traders’ interpretations of Bollinger Bands may vary, resulting in arbitrary trading decisions.
- Doesn’t operate in all market circumstances: It may not be useful in a sideways or choppy market where there’s little price movement.
Conclusion
Bollinger Bands is an effective technical analysis tool. It consists of three lines: middle, upper, and lower bands. The default setup is generally 20-period with a standard deviation of 2. The bands are used to analyze market volatility and trend strength, which is especially helpful when opening and closing trades fast in a volatile market. Traders should remember that the bands depend on historical data. As a result, they respond to price changes but do not project future price changes. You should always consider risk-management controls when trading with Bollinger Bands.


