The Heikin Ashi strategy is a powerful trading technique that simplifies trend analysis by using modified candlesticks.
Unlike traditional candlesticks, Heikin Ashi candles filter out market noise, allowing traders to clearly identify trends, spot potential reversals, and make more confident decisions in markets like stocks, forex, and crypto.
This guide will break down the Heikin Ashi formula, show you how to trade with it, and demonstrate why it’s a vital tool for both day traders and swing traders.
What is Heikin Ashi Strategy?
Candlesticks are one of the earliest types of technical indicators that traders may use to analyze asset prices. A candlestick chart helps traders see price movements and spot patterns, with each candle signifying a trading session.
The 18th century saw the invention of the Japanese charting technique known as Heiken-Ashi. Heikin-Ashi, which translates to “average bar” in English, is a charting technique that was developed to remove market noise from traditional candlestick charts and provide a clearer picture of the market trend. The strategy was initially applied to trading rice futures, but it has subsequently gained popularity in trading various other financial assets. Today, Heikin Ashi candles have developed into a significant asset in swing trading, intraday trading, and trend trading.
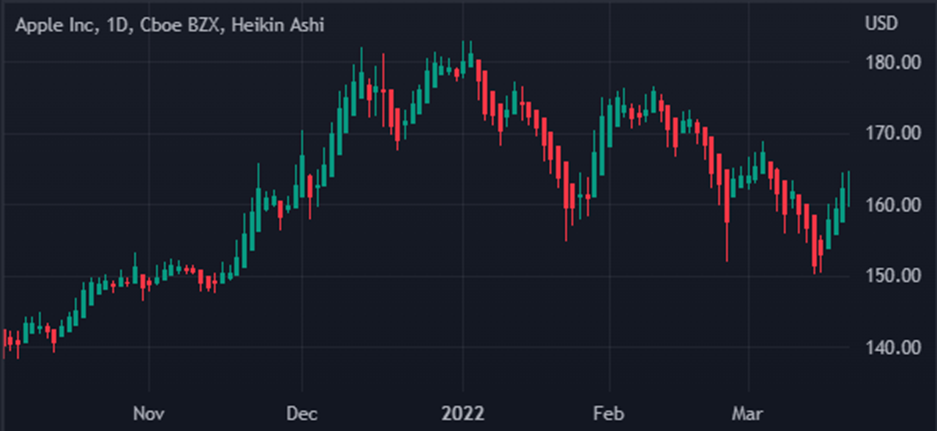
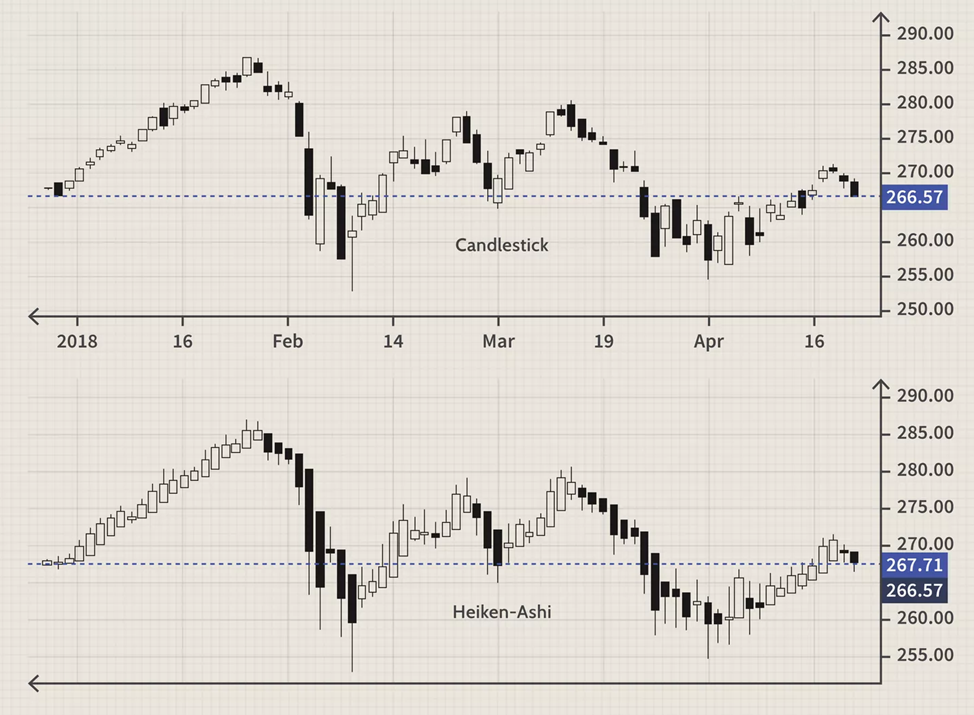
Heiken Ashi candlesticks use a special averaging technique, whereas traditional candlesticks plot their components using actual prices. This results in a smoother representation of price action. See the following illustration to understand what Heikin Ashi candles look like on a chart.
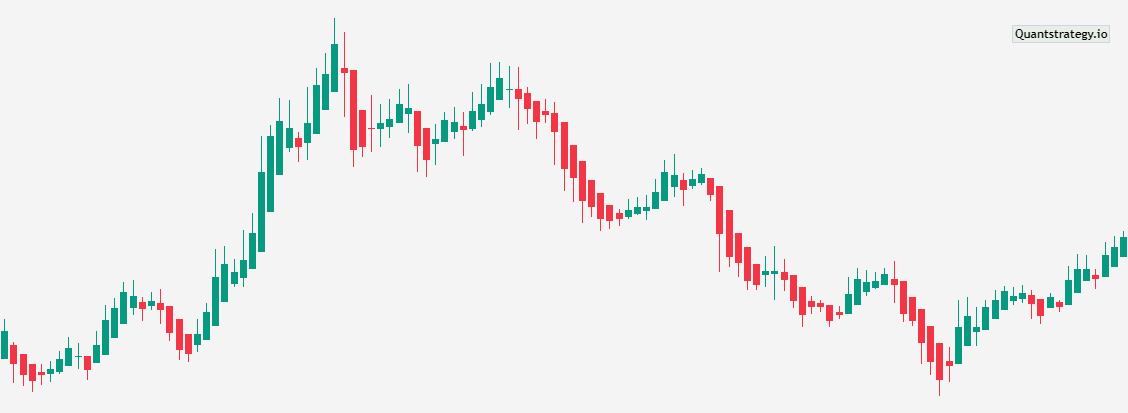
Compare the following candlestick chart to the image above.
In short, Heikin Ashi combines price averaging with candlestick charting to produce a better visual depiction of trends compared to traditional candlesticks. It reduces daily volatility to highlight actionable price trends.
Why? Because Heikin Ashi candles are less affected by market noise.
This technique employs average price data to reduce market noise. It assists traders in deciding whether to hold onto a trader or pause. The method also aids in predicting if a reversal will take place. In this way, traders can decide whether to lock in gains or avert losses on a particular position.
Heikin Ashi candles display the same four price levels as standard candlesticks (open price, close price, lowest and highest points), but their values are calculated based on data from the current and previous sessions. Nonetheless, Heikin Ashi charts can be used for the same periods as standard candlestick charts, making them helpful in scalping, day trading, or position trading strategies.
By comprehending the four main components of Heikin Ashi candles, which offer a particular manner of evaluating price action in financial markets, a trader can improve his forex, stock, or crypto trading techniques.
- Open: The midpoint between the open and close prices of the previous candle is the Heikin Ashi open. This averaging method makes it easier to recognize the current trend by providing consistency to the chart.
- High: The maximum figure among the high, open, and close prices for the current period is known as the Heikin Ashi high. This method accentuates the power of the bulls during an uptrend (buying pressure) by choosing the highest value.
- Low: The lowest value among the low, open, and close prices for the current period is known as the Heikin Ashi low. This parameter emphasizes the bearish forces driving a downtrend, assisting traders in determining selling pressure.
- Close: The average of the current period’s open, high, low, and close prices is known as the Heikin Ashi close. This fair depiction of price action enables traders to gauge the general mood of the market at a given time.
What is the Heikin Ashi Formula?
The Heikin Ashi chart develops by applying a modified formula that determines the open, close, high, and low values of each candle based on the prices of the previous candle.
Some of the calculations or formulas are more complex than those utilized for standard candlestick charts. Here is a condensed explanation of how to determine the open, close, high, and low for a Heikin Ashi chart:
- Average price (pivot) = (open + high + low + close) / 4
- Close = (open + high + low + close) / 4
- Open = (open of previous bar + close of previous bar)/ 2
- High = Maximum value (high, open, or close of the current period)
- Low = Minimum value (low, open, or close of the current period)
How to Read Heikin Ashi Charts?
Understanding the distinctive traits of a Heikin Ashi chart and how it relates to a traditional candlestick chart can help you interpret this pattern. Here are the basic steps to read them:
- Consider the color of the candle: In Heikin-Ashi charts, bullish candles are often colored green, while bearish candles are usually colored red.
- Recognize the body and wicks: The body of a Heikin Ashi candle indicates the average price movement over a given period, whereas the wicks demonstrate the price extremes within that time. The strength of the trend can be inferred from the length of the wicks.
- Identify Trends:
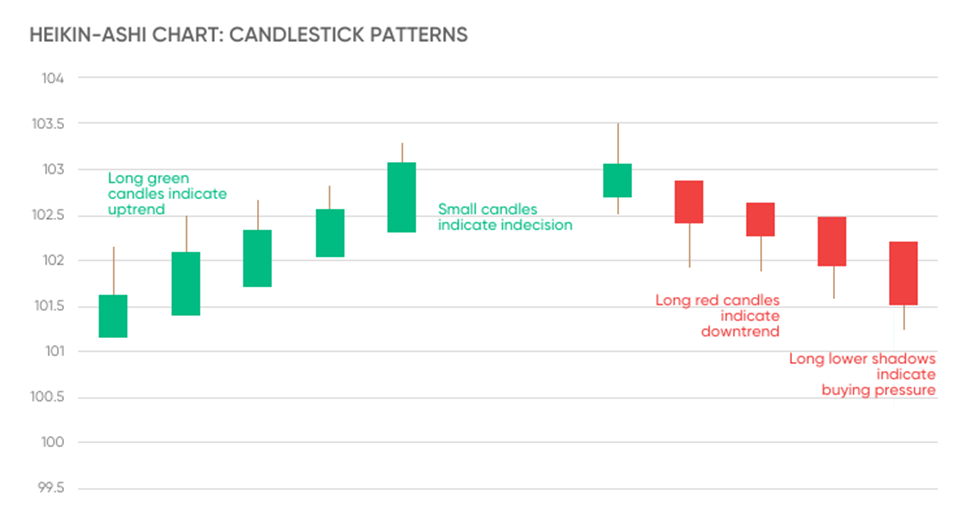
- Uptrends: Heikin Ashi charts indicate an uptrend when a string of green candles with short or no lower wicks emerge, signifying a strong bullish momentum.
- Downtrends: A downtrend is indicated by a series of red candles with minimal or no higher wicks, denoting predominately bearish forces.
- Consolidation: Heikin Ashi candlesticks with longer wicks that alternate between green and red indicate a consolidation period, which signifies indecision in the market.
- Look for trend reversal signals:
- Bullish Reversal: A bullish reversal is represented by a green Heikin Ashi candle after a string of red candles, frequently with a longer lower wick, signifying a probable change from bearish to bullish momentum.
- Bearish Reversal: On the other hand, a bearish reversal is indicated by the occurrence of a red candle after a series of green candles, usually with a longer upper wick, indicating a potential change in momentum from bullish to bearish.
- 5. Examine the chart’s smoothness: Heikin Ashi charts are renowned for their capacity to smooth out price fluctuations, rendering it simple to spot trends. Look for consistent, smooth patterns on the price chart because these can reveal important information regarding the market trend.
It may take some effort to read a Heikin Ashi indicator, but once you get used to how it differs from a normal candlestick chart, you’ll find that it is a useful tool for spotting market trends and making trading choices.
Heikin Ashi Chart vs. Renko Chart
Heikin Ashi candlestick charts are created using averages over two periods. On the other hand, Renko charts are produced by only depicting movements of a particular size.
A Renko chart is made up of bricks or boxes that are a specific size. The size can be set, or it can be determined using the average true range. Renko charts have a time axis, however, the boxes or bricks are solely affected by movement and not by time. While a new HA candle will appear every period, a new brick or box will only appear on a Renko chart after a specific amount of price movement.
Heiken Ashi Strategies for Trading
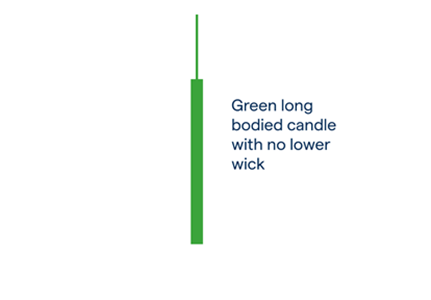
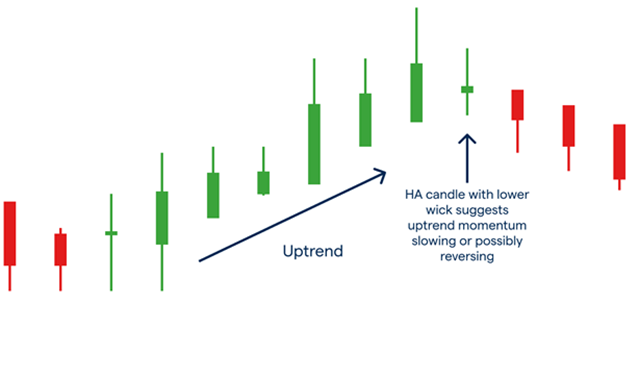
The Heikin Ashi chart can be used for trading in a few different ways. First, remember that each candlestick will provide you with information regarding the price trend. For instance, a green Heikin Ashi candle with a long body and no lower wick is seen to be a good indicator of a strong uptrend. These Heikin Ashi signals may be used by traders who have invested in a market as an indication to hang onto their holdings to maximize gains during an uptrend.
An uptrend may lose its bullish momentum when a lower wick starts to appear on a Heikin Ashi candle. Traders who have invested in a market may view this as a sign to begin looking to exit long positions.
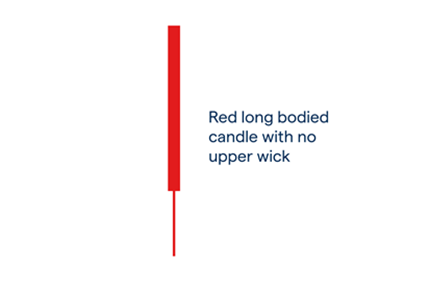
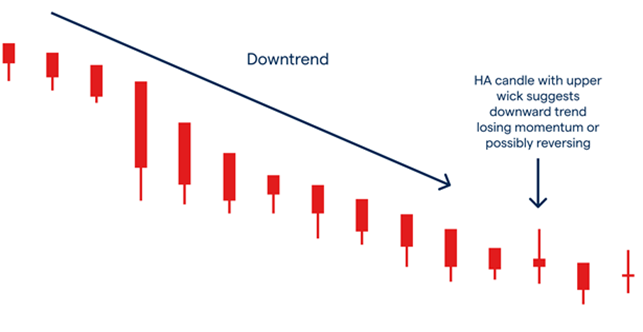
A long-bodied red Heikin Ashi candlestick with no upper wick indicates a strong downtrend. These HA signals may be used by traders who have shorted a market to continue holding onto their positions to increase profits during a bearish trend.
A downtrend may lose momentum if an upper wick starts to appear on the Heikin Ashi candlestick. This could be interpreted by traders who have shorted a market to start looking to exit their particular bearish positions.
Traders should be mindful of a trend pause if candles have a small body and longer wicks. The trend direction can then reverse, or it may continue to move in the same direction. The ability to determine which of those is most likely to occur requires some skill and experience.
When the direction and sentiment of the markets are changing, there is greater volatility, and candles with small bodies and long wicks resemble the dojis on traditional candlestick charts. The colors of the candlesticks change when trends change.
Besides candles, three types of triangles can be drawn on a Heikin Ashi chart – symmetrical, ascending, and descending.
The uptrend may continue when candles break above the top boundary of a symmetrical or ascending triangle, whereas the chart signals a bearish trend when candles fall below the bottom border of a descending triangle.
Since Heikien Ashi charts depict the longer-term directional market trend, applying trend indicators to Heikin Ashi’s strategy to gauge the price momentum of the market might be helpful. Then, knowing that daily swings have not been considered, you can trade by the findings of your study. Moving averages, the average directional index (ADX), and the relative strength index (RSI) are the three technical indicators that are most frequently used.
You can trade with the Heikin Ashi indicator by using derivatives like CFDs. You won’t acquire ownership of the underlying assets when you use derivatives. Instead, you’ll bet on their upward or downward price swings.
Advantages and Disadvantages of a Heikin Ashi Chart
Advantages
- Recognizing trends. Heikin Ashi charts, as opposed to traditional candlestick charts, may make it easier to see patterns. This is due to the fact that these charts emphasize the underlying trend while smoothing out the noise of random variations.
- Visual Representation: Heikin Ashi chart offers a visual display of the market, making it easier to understand chart patterns.
- Improved trading signals. The charts may help traders spot trading indications that aren’t always obvious on traditional candles charts. On Heikin-Ashi charts, for instance, the red and green “smoothed” candles can be utilized to determine if a trend is bullish or bearish.
- Less susceptible to false signals. Regular candlestick charts are more prone to misleading indications than Heikin-Ashi candlestick patterns. The reason is that the smoothing effect of Heikin Ashi minimizes short-term volatility and highlights longer-term patterns.
Disadvantages
- Delayed signals: The Heikin Ashi indicator might take longer to identify changes in trend or momentum due to the smoothing effect, which can be a drawback for traders who wish to join and exit trades instantly.
- Short-term restriction: The smoothing of price data may make it challenging to detect transient price trends.
- Uncertain data: Heikin Ashi strongly relies on the underlying data, which may be erratic or unreliable.
- The learning curve: Inexperienced traders may need some time to fully understand how to analyze and interpret a Heikin Ashi chart because it differs from a typical candlestick chart.
Conclusion
Heikin Ashi candlesticks provide a valuable tool for investors and traders who want to recognize trends and possible trend reversal patterns in a financial market. They filter out some noise and offer a smoother representation of price data over a particular period.
Despite the advantages, the Heikin Ashi trading strategy has some limitations, which can be overcome with experience and a careful risk management approach.
As with any tool or trading strategy, traders should conduct their research before making a choice. They should attempt to avoid trading more money than they can afford to lose.
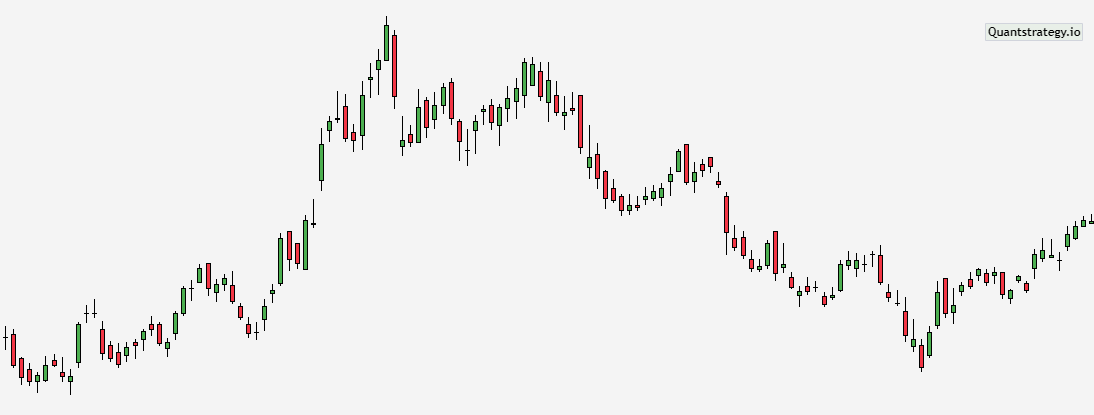
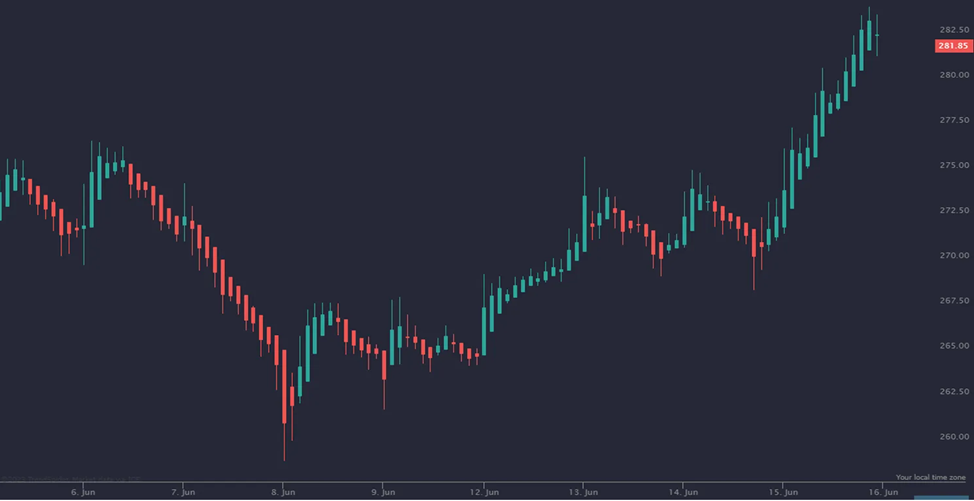
Quick Backtests
At QuantStrategy, we believe in validation through data.
That’s why we’ve built a library of backtests on foundational tools like the industry standard indicators.
Curious about the specific win rate, maximum drawdown, and overall performance of strategies on the 6000+ stocks?
We’ve done the heavy lifting.
Click here to explore the full backtest report and turn your market curiosity into a strategic edge.