


The Awesome Oscillator (AO) is a widely-used momentum indicator in trading. Its purpose is to help traders determine market momentum to predict potential trend direction or reversal. Fundamentally, it is a 5-bar simple moving average subtracted by a 34-bar simple moving average.
Like all other technical indicators, it is typically deployed as part of a bigger trading system to devise a strategy.
The Awesome Oscillator was created by Bill Williams, a popular technical analyst, and has become one of the preferred tools among traders for its reliability and simplicity.
In this article, we’re going to attempt to better understand what is Awesome Oscillator indicator and how to use it in trading. Keep reading.
What is the Awesome Oscillator?
The Awesome Oscillator is a popular technical analysis indicator developed by a trader named Bill Williams. He is also the man behind the development of the accelerator oscillator that works similarly to the Awesome Oscillator.
With the help of this market momentum indicator, traders can determine whether bearish or bullish forces dominate the financial market. Moreover, it compares recent market movements with historical trends.
It performs this by clubbing shorter-timeframe and longer-timeframe simple moving averages. Simply put, it compares a recent momentum to momentum over a longer period. Like all other indicators, it’s typically deployed as a part of a larger trading system.
The indicator can be configured for a variety of timescales, including minutes (very short-term), hours (short-term), days (medium-term), and months (long-term). Note that the Awesome Oscillator indicator is a universal indicator that operates equally well in all financial markets, including crypto markets, indices, currency, stock, and commodity markets.
Similar to other technical indicators, the Awesome Oscillator operates based on a zero line and is positioned at the lower part of the chart in a designated window. However, unlike conventional moving averages that rely on the closing price of candlesticks, this indicator employs the midpoint of the candlestick range.
The indicator creates a histogram by plotting the two moving averages’ differences.
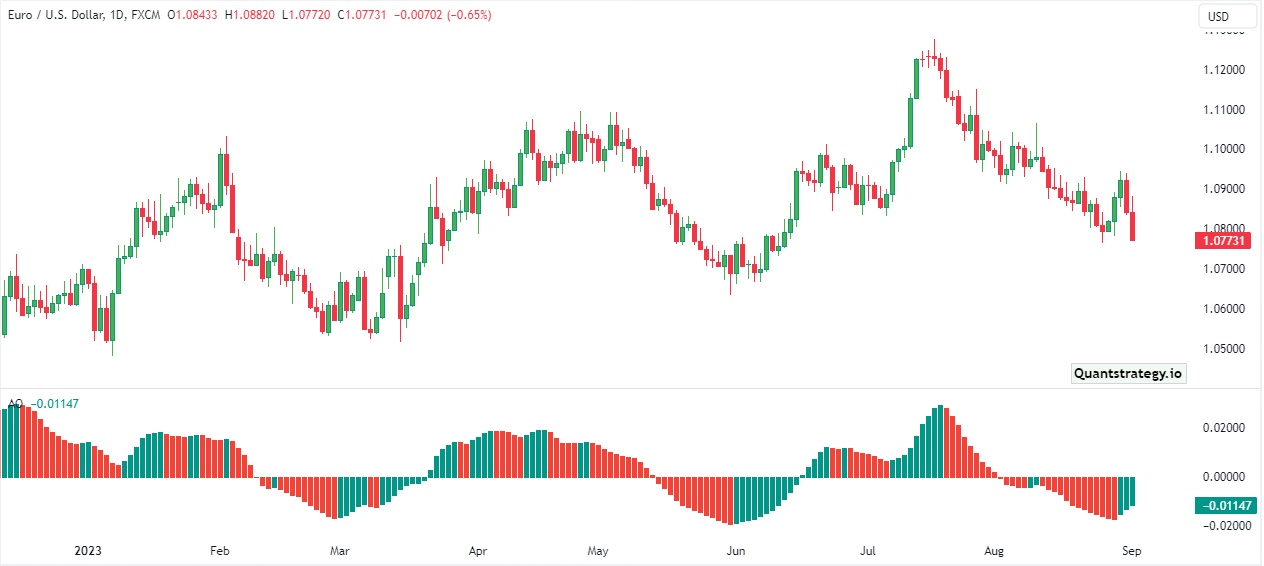
There is a zero line in the middle, which serves an important role while using the indicator. The comparison of two distinct moving averages is utilized to depict the price changes on both sides of the zero line.
The indicator fluctuates above and below this neutral line. Ideally, when the histogram is above the zero line, it usually indicates that the price is bullish. On the contrary, when the histogram is below the zero line, it is generally a bearish indication. However, similar to other technical indicators, there’s no guarantee that the price will begin increasing immediately after the indicator moves above zero.
The standard histogram is presented as either a red or green bar, whereby the color red is indicative of a value that is lower than its prier bar, whereas the color green suggests a higher value than the prier one.
The oscillator is usually used to verify a short-term momentum; however, can also be employed to anticipate a possible trend reversal.
Awesome Oscillator Formula
To determine the Awesome Oscillator value, the 5-period simple moving average is subtracted from the 34-period simple moving average. But rather than using the close prices, SMAs use the middle of the candlesticks (median prices). As mentioned before, this momentum indicator is suitable for computing any timeframe (trading session), including minutes, hours, days, and even months.
Most trading systems come with a pre-installed Awesome indicator, and clicking on it from the indicator section of the platform will plot it on the chart. Yet only for educational purposes, the calculation of the Awesome Oscillator formula is as follows:
Awesome Oscillator = 5-period SMA (median prices) — 34-period SMA (median prices)
Where the median price of any price period is given as:
Median price = (High + Low)/2
Instead of using the closing prices, Bill Williams prefers to employ the median prices since they give the trader more insight into the day’s activity.
For example, the mid-point will be higher if there occurs a lot of volatility. However, if a closing price was used and there was a significant reversal, the trader or investor would not be able to capture the volatility that occurred during the day.
Awesome Oscillator Trading Strategies
Based on the information above, the Awesome Oscillator indicator is a promising addition to any trader’s technical analysis arsenal. The only thing that is yet to be covered is what can be the best trading strategy for this indicator.
Surprisingly the Awesome Oscillator generates several different signals that can be put together to create the basis of the Awesome Oscillator trading strategies for forex or any other financial market which takes your fancy.
Let’s learn some of the most profitable trading strategies that can be tested out using the oscillator alone.
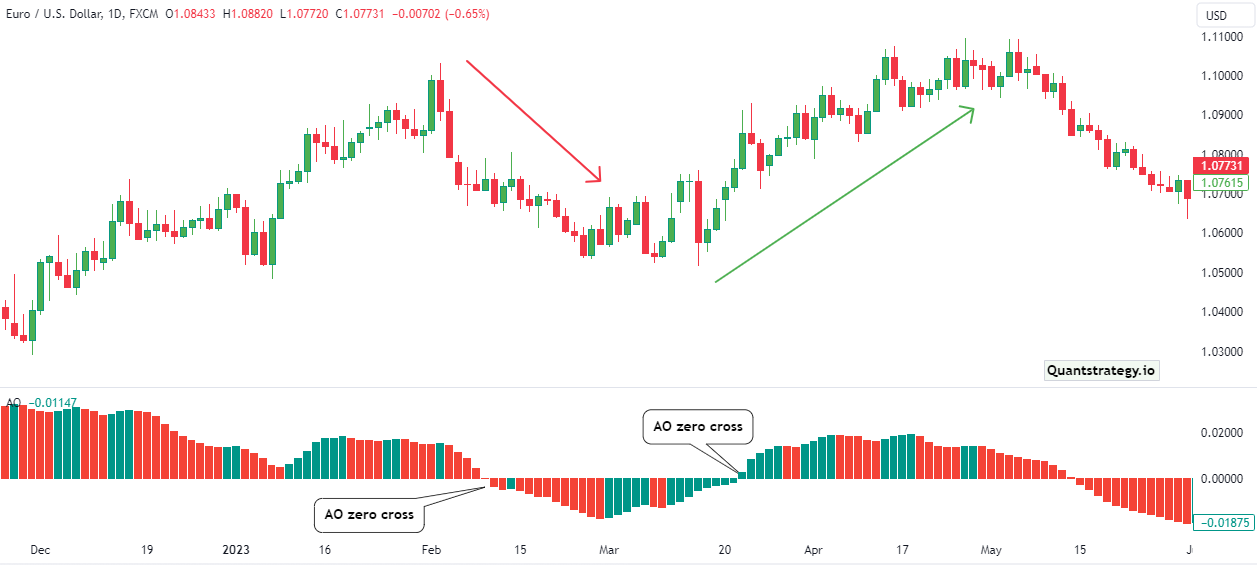
Zero Line Crossover
Zero-line crossover is the simplest strategy for Awesome Oscillator (AO). It illustrates a change in the market momentum. A buy signal is indicated when the Awesome Oscillator crosses above the zero line from the negative (below 0) zone to the positive (above 0) zone.
Whereas a sell signal is indicated when the indicator crosses the zero from the above zero line and continues to the negative (below 0) zone.
Some of you might believe that buying whenever it rises above and selling whenever it falls below can be beneficial. It is in theory, but without confirmation, one shouldn’t depend on any single AO indicator. Furthermore, using this strategy in conjunction with other fundamental analyses and indicators is preferred.
Saucer Strategy
The saucer strategy is another Awesome Oscillator strategy in which traders identify signals by looking for three consecutive bars on the histogram.
The layout consists of three continuous bars, with the extremes being somewhat taller than the middle bar.
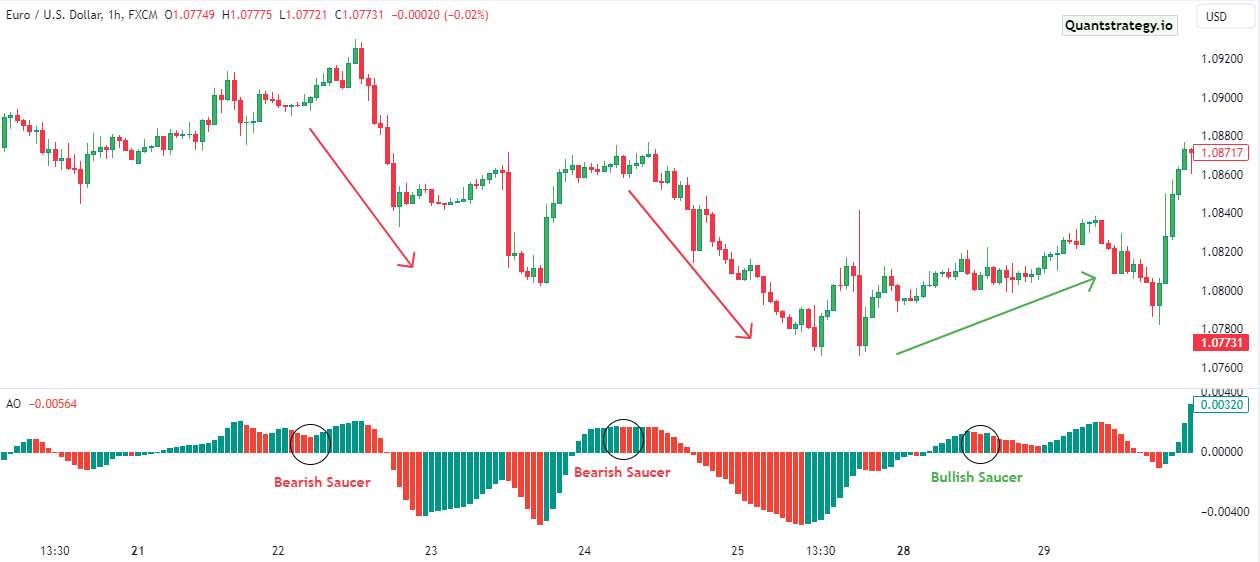
Conditions with a Bullish Saucer (Buy signal):
- Awesome Oscillator above zero line
- A green bar immediately follows two consecutive red bars and higher the second red bar.
- An order is placed on the opening of the AO’s fourth bar.
The bearish saucer formation predicts a change in price momentum and the entry of that position.
Conditions with a Bearish Saucer (Sell Signal):
- Awesome Oscillator below zero line
- A red bar immediately follows two consecutive green bars and lower the second green bar.
- An order is placed on the opening of the AO’s fourth bar.
The bearish saucer pattern, sometimes referred to as the ‘inverted saucer’, is a reliable sell signal and predicts that the market’s slump will probably continue.
Twin Peaks Strategy
Another method in the list of Awesome Oscillator strategies is the Twin Peaks Strategy. It is a basic trading strategy that looks for double tops in the AO indicator.
Bullish Twin Peaks
- AO is below 0.
- Two swing lows of the AO indicator are there, and the 2nd low is higher than the first one.
- Histogram is green after the 2nd low.
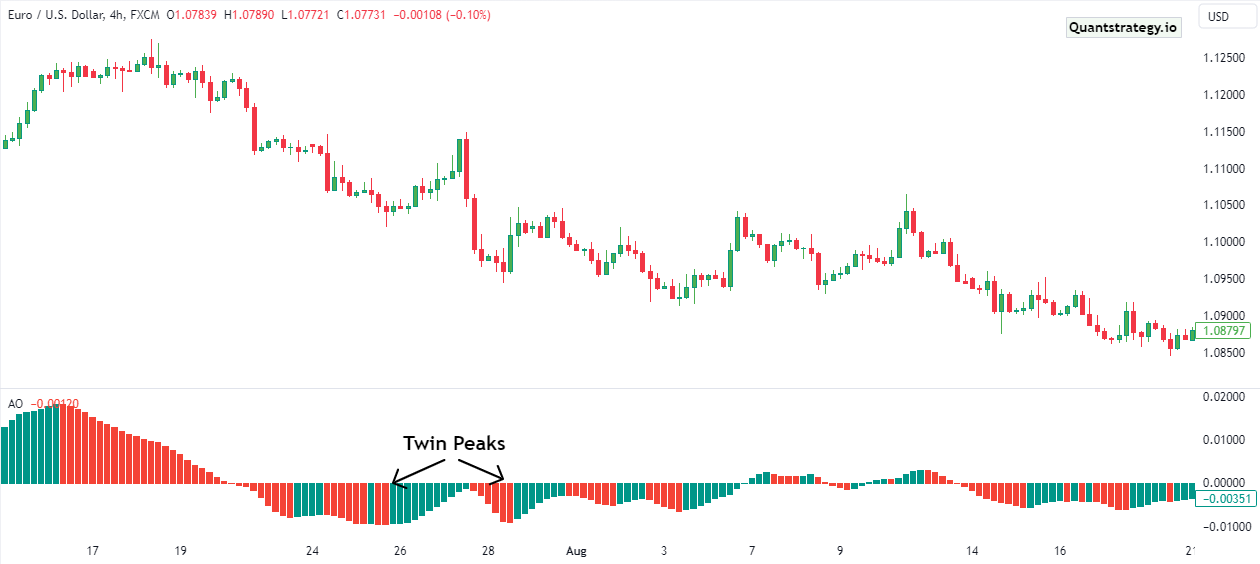
Bearish Twin Peaks
- AO is above 0.
- Two swing highs of the AO are there, and the 2nd high is lower than the first one.
- Histogram is red after the 2nd low.
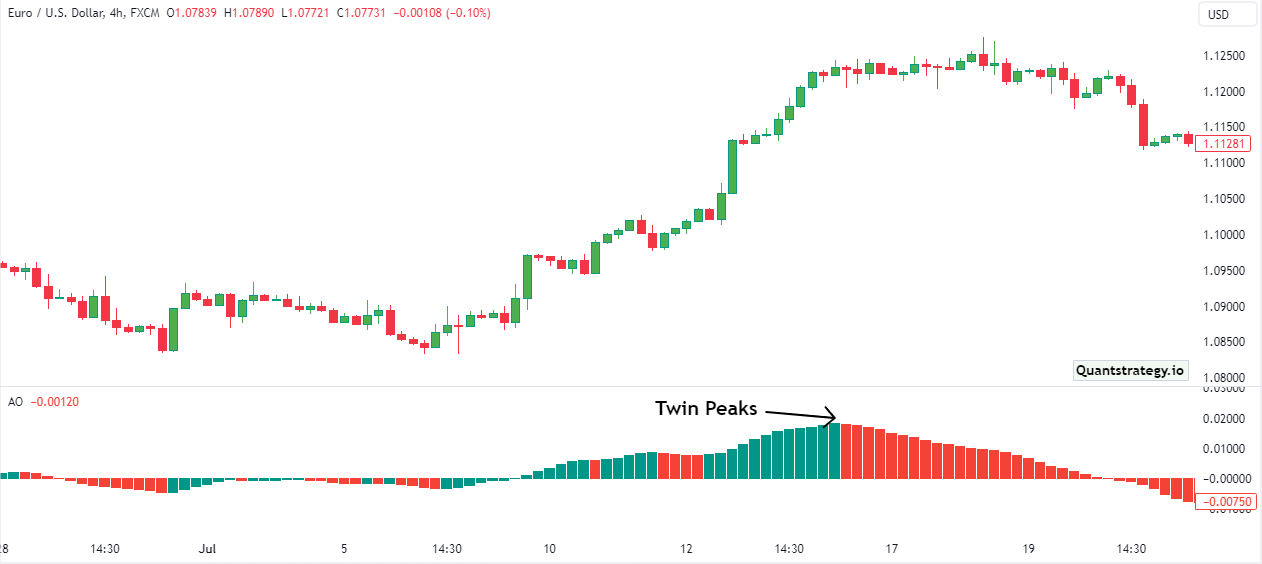
This trading strategy is sometimes the most preferred one because it explains the current setup of the stock. It is also a contrarian technique as one enters short positions when the oscillator is above zero and buys when below zero.
Divergence
When the price direction of an oscillator and asset have inconsistency, this is known as a divergence in day trading. For instance, a divergence happens when the oscillator drops while the asset’s price rises.
Like any other oscillator, the Awesome Oscillator by Bill Williams can successfully help in determining divergence. Observe how in the example below, the AO is losing momentum while the price of the BTC/USDT pair is increasing.
Awesome Oscillator can be used in day trading to spot potential trades because it can be deployed to identify potential reversals in price trends. For instance, bearish divergence signals that long positions should be closed because the price will most likely balance itself. Bullish divergence, on the other hand, suggests that a trader should cut all short positions.
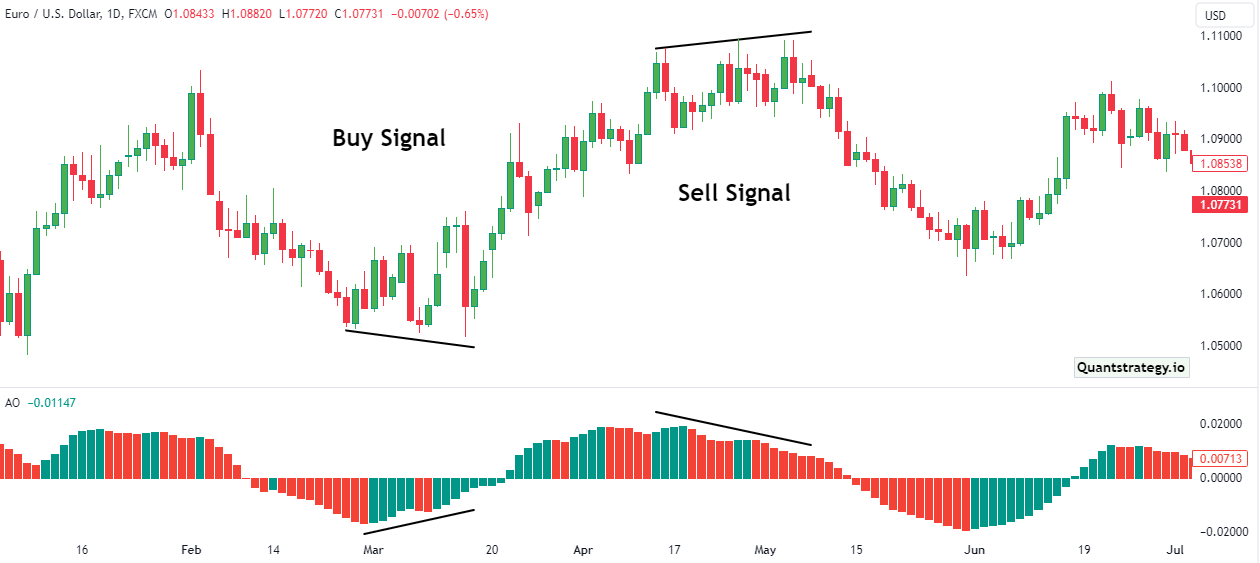
A sell signal is prompted when the price of an asset depicts higher highs and the Awesome Oscillator creates lower highs. This is referred to as Bearish Divergence.
A buy signal is prompted when the price of an asset makes lower lows and the Awesome Oscillator forms higher lows. This is referred to as Bullish Divergence.
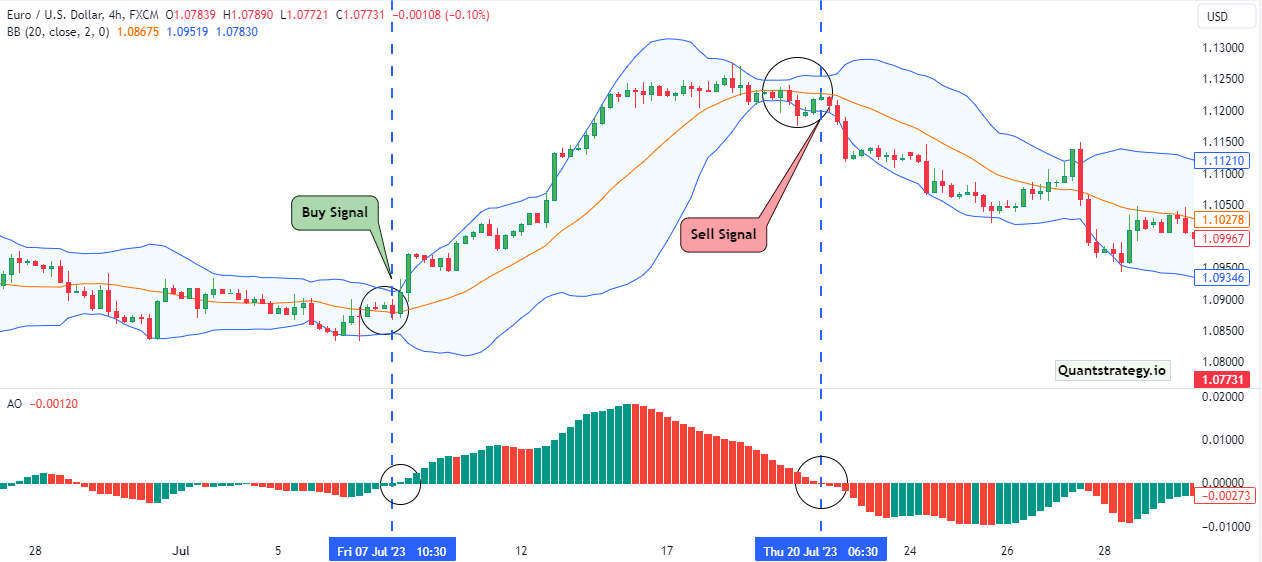
Scalping Strategy
Scalping is a method where traders focus on attaining small and frequent profits in volatile markets. This Awesome Oscillator trading strategy can be used in any timeframe, though it is advantageous in positions that last for smaller timeframes, such as a few seconds or minutes.
As a scalping indicator, AO helps in capturing asset momentum, particularly when used in conjunction with other indicators, such as Bollinger Bands.
Using the Awesome Oscillator Scalping Strategy, a trader can capitalize on the price momentum by identifying areas where the oscillator diverges from price movement. Trading should be initiated inside the divergence’s range to optimize profits, and positions should be closed as soon as the momentum changes.
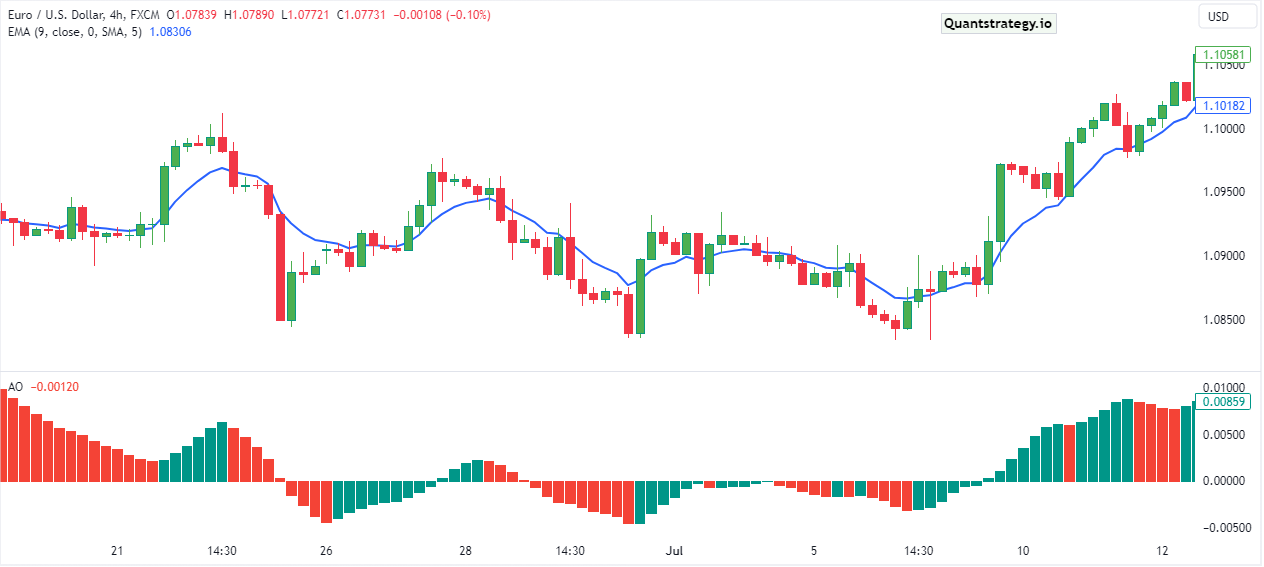
Combining with Other Indicators
Last but not least, you can combine the Awesome Oscillator with various indicators. For instance, when following a trend, you can use an oscillator and moving average together to determine when a reversal is about to occur. The graph below provides a good example.
As you can see, there has been a significant rising trend in the USD/ZAR pair. The price was above the 34-day simple moving average at the time, and the oscillation was above the neutral line.
Here are some common indicators that traders use in conjunction with the AO indicator:
- Moving averages: Traders often use moving averages to determine the overall trend of an asset. Combining moving averages with the AO indicator can help traders identify trend direction and potential reversal points.
- Relative Strength Index (RSI): RSI is another momentum indicator that helps traders identify overbought and oversold conditions. Combining the AO indicator with RSI can provide a more comprehensive picture of the price action and help traders make better decisions.
- Bollinger Bands: Bollinger Bands are volatility indicators that help traders determine the range in which an asset is likely to trade. Combining the AO indicator with Bollinger Bands can help traders identify potential price breakouts and determine the likelihood of a strong trend.
Overall, traders should test different combinations of indicators and find the ones that work best for their trading style and risk tolerance. It’s important to note that no indicator or combination of indicators can guarantee profitable trades, and traders should always use appropriate risk management strategies.
Conclusion
Awesome Oscillator emerged and grew famous thanks to a popular expert Bill Williams. The indicator helps find the onset of movement on a price chart, tracks a correction that is coming to an end, and alerts regarding a possible reversal.
Awesome Oscillator is simple and reliable, which enables traders to measure market momentum and trends. Its ability to be employed together with various analysis tools further uplifts its effectiveness.


