

Positive Volume Index (PVI) is used for technical analysis of the price changes in the market, based on trading volume. PVI indicates price movements after factoring in whether the present trading volume is greater than the volume for a previous period.
In this blog post, we will discuss what the PVI is, how it works, and how traders can use it to make informed trading decisions.
What is the Positive Volume Index (PVI)?
The Positive Volume Index (PVI), as well as the Negative Volume Index (VMI), indicator tracks the changes in the number of transactions, or trading volume, of an instrument. Price changes on decreasing trading volume are considered to be a positive indicator, while price changes during periods of increased trading volume are considered to be a negative indicator.
The idea behind the indicator is that well-informed traders (“smart money”) are involved when trading volumes decrease while increasing trading volumes can indicate a follow-the-crowd mentality (“not-so-smart money”).
The PVI is calculated by taking the previous day’s PVI and adding it to the percentage change of the security price if today’s volume is higher than the previous day’s volume. If today’s trading volume is lower than the previous day’s volume, the PVI remains the same.
How does the Positive Volume Index (PVI) work?
The PVI is used to identify the strength of a bullish trend in security. When the PVI is increasing, it indicates that the buying pressure in the market is strong, which is a bullish signal.
On the other hand, when the PVI is decreasing, it indicates that the selling pressure in the market is strong, which is a bearish signal. The PVI can also be used to confirm trends in conjunction with other analysis techniques, such as moving averages or the on-balance volume indicator.
Using the Positive Volume Index (PVI) with other volume indicators
The PVI is just one of several volume indicators used in technical analysis. Other volume indicators include the Negative Volume Index (NVI), the Trade Volume Index (TVI), the Volume Weighted Average Price (VWAP) indicator, and the Money Flow Index (MFI).
These indicators can be used in conjunction with the PVI to confirm trading signals and improve trading strategies.
How to calculate the Positive Volume Index (PVI)
The PVI is calculated by taking the previous day’s PVI and adding it to the percentage change of the price if the trading volume is higher than the previous day’s volume. If the trading volume is lower than the previous day’s volume, the PVI remains the same. The PVI can also be calculated on a cumulative basis over a given period, such as a week or a month.
If you have to calculate the PVI for today then you need to take into account the trading volume of today as well as of the previous day.
If today’s volume was greater than that of the previous day’s, you can use the following formula :
PVI = Previous day’s PVI + ((Today’s close – Previous day’s close)/Previous day’s close).
If Today’s trading volume was equal to or less than the Previous day’s trading volume then the formula will be:
PVI = Previous day’s PVI.
Advantages of using PVI
The PVI provides a clear signal of the strength of a bullish trend, allowing traders to make informed trading decisions. It can also be used to confirm trends and avoid false signals when used in conjunction with other analysis techniques.
Additionally, the PVI is a cumulative indicator, which means it takes into account the volume of trades over a given period rather than just one day’s volume.
Positive Volume Index Limitations
Despite its advantages, the PVI has some limitations that traders should be aware of. For instance, it may not be as effective in a bear market or stocks with low trading volume.
Additionally, the PVI may provide false signals during periods of high volatility, which can lead to losses for traders.
How to use in Trading: Examples
Let’s take a look at an example of how the Positive Volume Index (PVI) can be used in trading. Suppose you are analyzing the stock of a company that has been in an uptrend for several weeks. You notice that the PVI has been increasing over this period, which
Volume Indicators and Volume Analysis
Volume indicators are technical analysis tools used to analyze and track changes in trading volume over time. These indicators help traders understand market trends, trading patterns, and investor sentiment. Volume analysis is a critical component of technical analysis and is used in conjunction with other analysis techniques to make informed trading decisions.
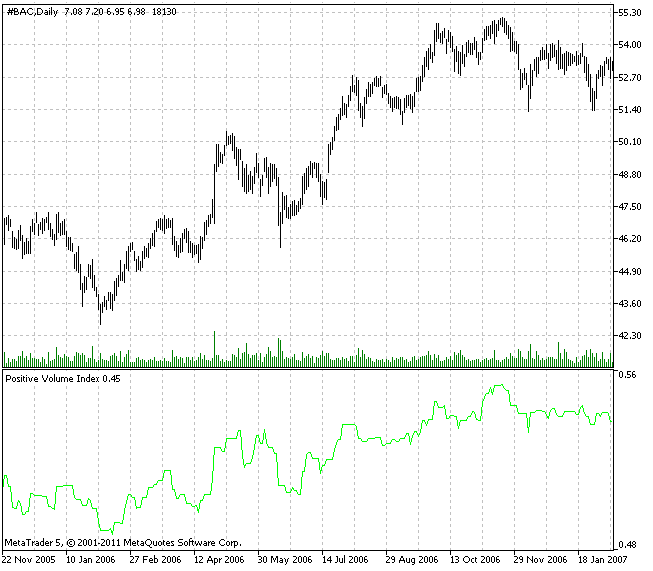
The Positive Volume Index measures volume on the points where the volume is greater than the prior point.
The Positive Volume Index (PVI) interpretation posits that an increase in volume signifies the involvement of “uninformed” investors who move with the crowd. On the other hand, a decrease in volume suggests that the “smart money” is strategically positioning itself in the market.
Values for PVI greater than their one-year Moving Average are commonly seen as bullish.
The Negative Volume Index measures volume on the points where the volume is less than the prior point.
The Negative Volume Index (NVI) interpretation hinges on the premise that when the trading volume surges, it is the uninformed investors who are dictating the market direction. Whereas, on days with low trading volumes, the smart money is believed to be quietly taking positions. As a result, the NVI indicates the smart money’s activity in the market, reflecting their buying or selling positions.
Values for NVI greater than their one-year Moving Average are commonly seen as bullish.
Volume Weighted Average Price (VWAP)
The Volume Weighted Average Price (VWAP) is a technical indicator that measures the average price of a security based on its trading volume. The VWAP is calculated by dividing the total value traded by the total volume traded over a given period. This indicator is often used by traders to determine whether a security is being bought or sold at a premium or discount to its average price.
Trade Volume Index (TVI) Indicator
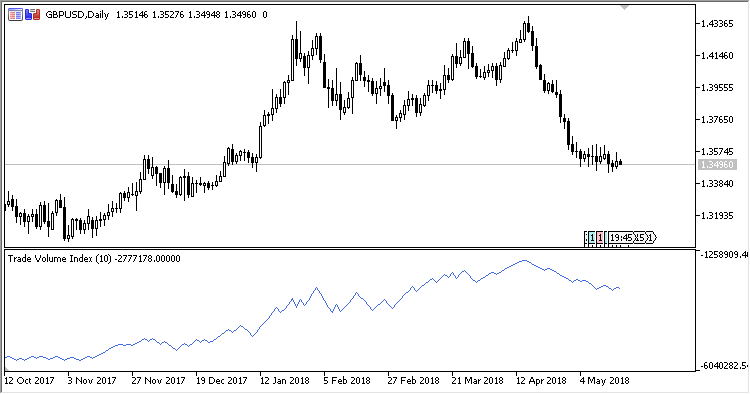
The Trade Volume Index (TVI) indicator is a technical analysis tool that helps traders identify the smart money in the market. The TVI indicator is based on the principle that smart money trades when the volume increases and the price moves in the opposite direction. The TVI indicator is calculated by adding or subtracting the volume of trades on an up day or a down day respectively.
Money Flow Index (MFI)
The Money Flow Index (MFI) is a momentum indicator that measures the buying and selling pressure of a security based on its trading volume and price data. The MFI indicator is calculated by comparing the average price of a security over a given period with the volume traded on up days and down days. This indicator is often used by traders to confirm the strength of a trend and to identify potential reversal points.
On Balance Indicator (OBV)
The On Balance Indicator (OBV) is a technical analysis tool that helps traders identify buying and selling pressure in the market. The OBV indicator is based on the principle that volume precedes price movement. The OBV indicator is calculated by adding the volume on up days and subtracting the volume on down days. This indicator is often used by traders to confirm the strength of a trend and to identify potential reversal points.
Cumulative Volume Indicator (CVI)
The Cumulative Volume Indicator (CVI) is a technical analysis tool that measures the total volume traded in a given period. The CVI indicator is calculated by adding the volume traded on up days and down days. This indicator is often used by traders to identify trends in trading volume and to confirm the strength of a trend.
Minimum Tick Value
The Minimum Tick Value is the smallest amount that security can move in price. This value is determined by the exchange on which the security is traded and is often used by traders to determine the potential profit or loss on a trade.
Smart Money vs. Not-So-Smart Money
Volume analysis can help traders identify the smart money in the market. Smart money refers to institutional investors and other large traders who have access to information that is not available to the general public.
How to Use the PVI and NVI for Trading
The Positive Volume Index and the Negative Volume Index can be used as trading tools in various ways. Some of the most common approaches include:
Trend Confirmation: The PVI and NVI can help confirm the direction of a trend. When the PVI is rising and the NVI is falling, it suggests that the uptrend is strong, and vice versa. Traders can use this information to enter trades in the direction of the trend.
Divergence: Divergence occurs when the price of a security is moving in the opposite direction of the PVI or NVI. For example, if the price is increasing, but the PVI is decreasing, it suggests that the buying pressure is decreasing, and the trend may be losing steam. Traders can use this information to exit long positions or enter short positions.
Breakouts: Breakouts occur when the price of a security moves beyond a significant level of support or resistance. When this happens, the PVI and NVI can help confirm the breakout by showing an increase in volume in the direction of the breakout. Traders can use this information to enter trades in the direction of the breakout.
Reversals: Reversals occur when a trend is about to change direction. The PVI and NVI can help identify potential reversals by showing changes in buying and selling pressure. For example, if the PVI is falling and the NVI is rising, it suggests that the buying pressure is decreasing, and the selling pressure is increasing. Traders can use this information to exit trades or enter trades in the opposite direction of the trend.
Using the PVI with Other Volume Indicators
The PVI can be used in conjunction with other volume indicators to provide additional insight into market trends. For example, traders can use the Volume Price Trend (VPT) indicator to confirm the direction of the trend and the PVI to confirm the strength of the trend.
The Money Flow Index (MFI) can also be used in conjunction with the PVI to confirm the buying and selling pressure.
Limitations of the PVI and NVI
While the PVI and NVI can provide valuable insights into market trends and trading signals, they are not foolproof.
Like all technical indicators, they have limitations and can provide false signals. For example, the PVI and NVI may not be effective in markets with low volume or during periods of extreme volatility.
Additionally, traders should not rely solely on the PVI and NVI for trading decisions. It is important to use these indicators in conjunction with other analysis techniques such as price action, moving averages, and momentum indicators.
Conclusion
In summary, the Positive Volume Index and Negative Volume Index are valuable technical indicators that can provide insight into market trends and trading signals.
The PVI measures buying pressure, while the NVI measures selling pressure, and both can be used in a variety of ways to make informed trading decisions.
However, traders should be aware of the limitations of these indicators and use them in conjunction with other analysis techniques for more accurate trading decisions.
By understanding and utilizing the PVI and NVI, traders can gain a better understanding of the underlying market trends and make more informed trading decisions.


