


Understanding and interpreting indicators is paramount in the technical analysis of stocks. They see common usage in nearly all forms of trade as they can help investors and brokers simplify and scrutinize the enigmatic pattern of stock price movements.
We’re all aware that the stock market has no holy grail. Yet indicators and oscillators rationally investigate stock movements, predict future movements (at least to some extent), and create various trading opportunities. One key example of these technical indicators is the TRIX indicator.
Let us learn about this useful and versatile indicator in greater depth below.
What is the TRIX Indicator?
TRIX indicator, also called triple exponential average, is a momentum indicator used by traders that displays the percentage rate of change in a moving average, which has been triple exponentially smoothed. This means that it filters out unimportant price movements by removing them from the indicator (a technique called smoothing), permitting investors to pay attention to the larger movements.
The indicator’s name was developed in this manner. Tri is triple, and ‘X’ is an acronym for the exponential moving average.
The TRIX indicator is relatively modern. It was created during the early 1980s by an editor named Jack Hutson, who was an editor of the Technical Analysis of Stocks and Commodities magazine. The aim was to find a combined solution of an oscillator and a trend indicator.
The TRIX has three main segments.
- Zero line
- TRIX line
- Percentage Scale
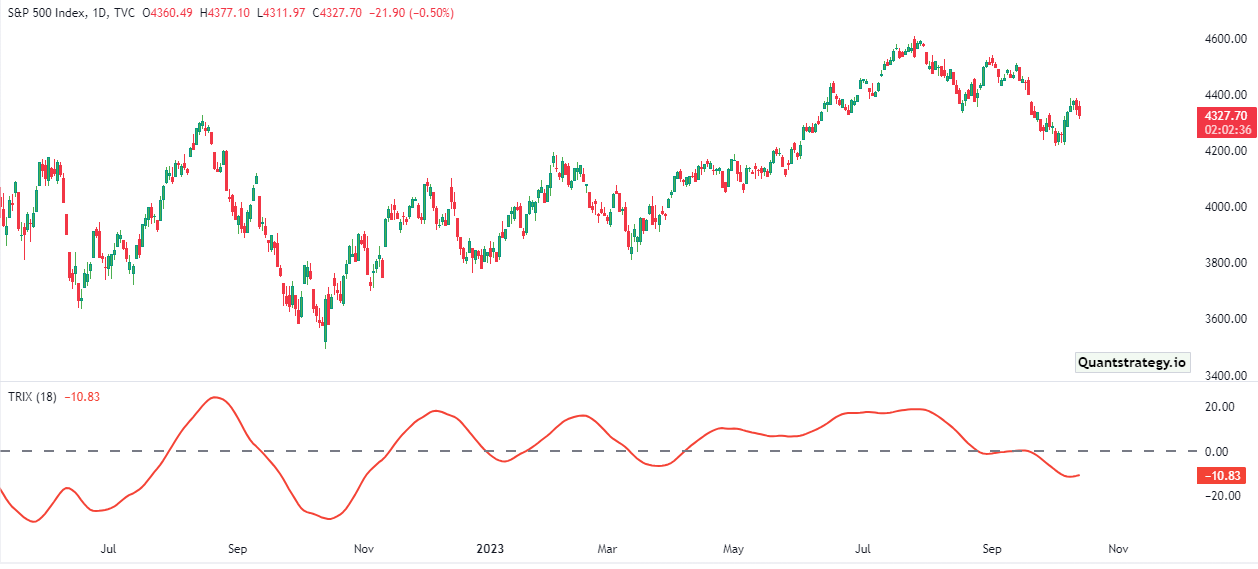
The TRIX oscillates over the zero line to exhibit a trend, while the peaks and troughs produced by the TRIX curve assist in spotting overbought and oversold levels.
Any TRIX movement over the zero line is characterized as a buy signal for analysts. Similarly, a sell signal occurs when the TRIX line goes under the zero line. The potential separation of price and TRIX may indicate a significant landmark in the stock market.
TRIX is sometimes called the “Impulse indicator” because it accurately tracks both positive and negative market impulses. In other words, the TRIX indicator accurately depicts rising and sinking stock price impulses.
Chartists can use a triple exponential average to produce signals similar to other indicators like RVI (Relative Vigor Index) and MACD (Moving Average Convergence Divergence). A signal line can be employed to search for signal line crossovers. The absolute level can be used to identify a directional bias. Reversals can be predicted using bullish and bearish divergences.
How is TRIX Calculated?
TRIX is a percentage change of the triple-smoothed exponential moving average of a price for a last bar or candle.
As a result, a step-by-step evaluation is required to find the TRIX indicator. They are as follows:
- Calculate the single exponential moving average (EMA) of the asset’s price for a specified period (usually 15 days).
- Calculate the double EMA of the first EMA for the same period.
- Calculate the triple EMA of the second EMA for the same period.
- Calculate the percentage change in the triple EMA for the last bar or candle.
This is a triple-smoothed EMA rate-of-change (ROC) of one period that was computed in step 3. It enables the technical analysts to determine the rate of change of the variable over a predetermined period.
The EMA of a price is calculated from the expression:
EMA1(i) = EMA (Price, N, 1)
Where:
Price(i) = Current Price
EMA1 = Current value of the Exponential Moving Average
The acquired average is then subjected to a second smoothing-double exponential smoothing:
EMA2(i) = EMA (EMA1, N, i)
The triple exponential moving average results from another exponential smoothing of the double exponential moving average:
EMA3(i) = EMA (EMA2, N, i)
Next, the indicator itself is determined with:
TRIX(i) = EMA3(i) – EMA3(i – 1)/EMA3(i-1)
The letter “n” represents a certain period – usually it is equal to 15.
How to Trade Using the TRIX Indicator?
The triple exponential average is a trend-following oscillator that is useful in keeping the investors in-trend for a particular time or shorter than that. Since it’s a triple-smoothed exponential moving average, it unravels whipsaw movements in trending markets and prevents traders from getting confused because of price volatility.
Although this indicator can be effective in a trending market, it may generate inaccurate signals and whipsaws in a market that is trading in a range. Therefore, it is recommended to use it cautiously and only in a trending market.
Trading Strategies for TRIX Indicator Signals
The triple exponential average, in its most standard form, generates the following interpretations:
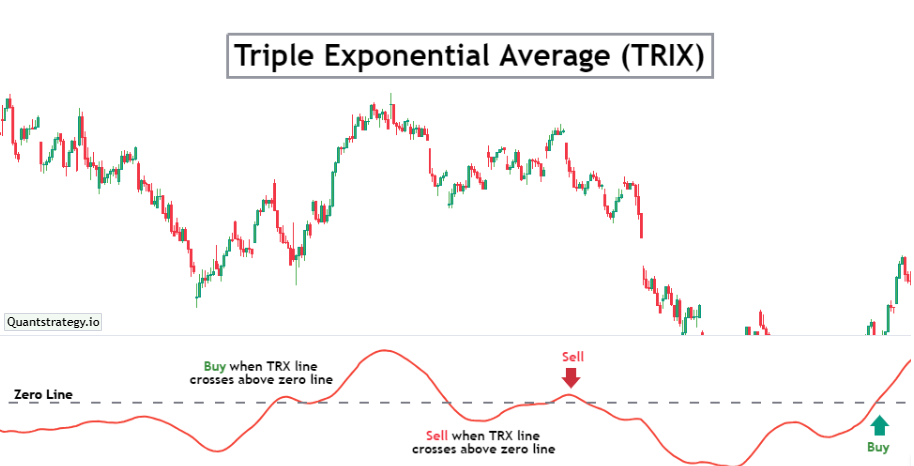
Zero-line Crossovers
Zero-line crossover signals are generated as TRIX oscillates around the zero line. This signal can be deployed in ascertaining the market movement.
The TRIX indicator changes from negative to positive values when it moves around the zero line from bottom to top. This implies that the trend has shifted in a positive direction. Thus, investors and traders can look for placing buy orders in the market.
When TRIX lines move in a direction, which takes them below the zero line, negative values get assigned to this indicator. This implies that the trend has moved in a negative direction, so investors and traders should look to place sell orders in the market.
Signal Line Crossovers
Signal line crossovers are the most commonly occurring TRIX signals. A signal line is a 9-day EMA of the TRIX indicator. Since it is a moving average of this indicator, it trails TRIX and renders it easier to identify turns.
When the TRIX indicator turns up and crosses above the signal line, a bullish crossover occurs. A bearish crossover occurs when the TRIX indicator turns down and crosses underneath the signal line. Traders can use this trading strategy in markets, which are either trending or range.
In range-moving markets, the signal line crossover exhibit that both support and resistance zones have been maintained. Signal line crossovers in already moving markets verify the end of price retracement and restart of the primary trend.
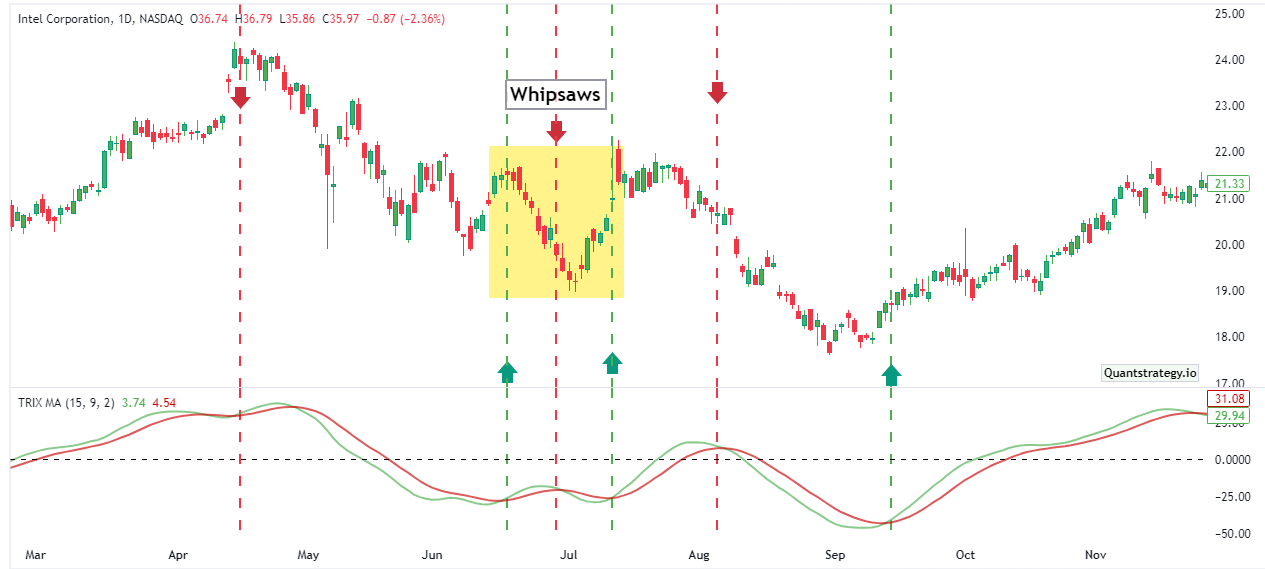
In the seven months period depicted in the chart above, there were six signal line crosses between the signal line and TRIX. That amounts to nearly one every month. Whipsaws (yellow region) were caused by three good signals and three bad signals. The bearish crossover in late June happened close to the low, the bullish crossover in July happened close to the top, and the bullish crossover in July happened near the top. The triple-smoothed EMA’s latency causes late signals that result in losses when there isn’t a strong move. The bullish signal line cross in mid-September foretold a significant advance, while the bearish signal line cross in August foreshadowed a steep collapse.
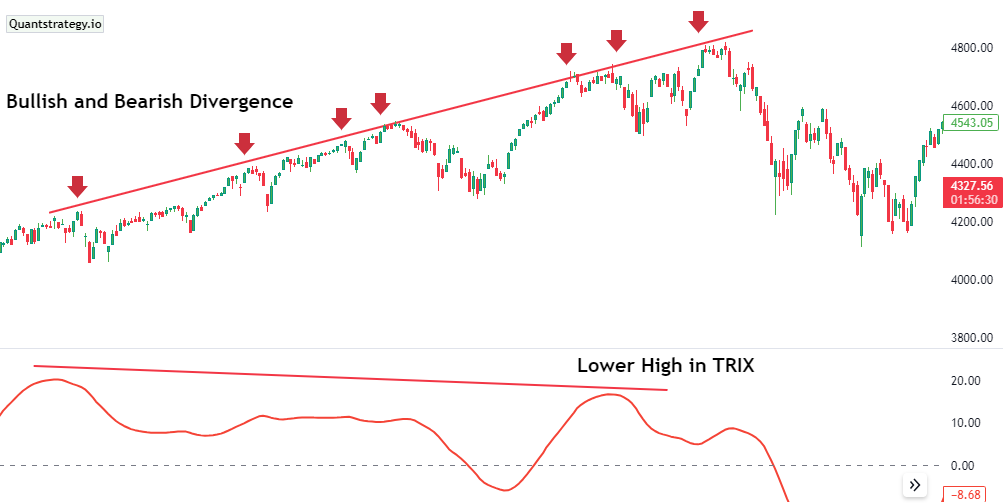
Divergence
The TRIX indicator can also be used by traders to identify when turning points will occur in the market. This is where the role of divergence comes, which can be either bearish or bullish.
Bullish and bearish divergences form when the price of a stock/security and the indicator don’t confirm one another. When the security creates a lower low while the TRIX indicator makes a higher low, a bullish divergence forms.
A bearish divergence forms when the security creates a higher high while the TRIX makes a lower high.
Conclusion
The TRIX indicator combines both a momentum indicator and an oscillator, serving as a multifunctional tool. It can be utilized as both a trend momentum indicator and an oscillator, making it an extremely useful and versatile tool for traders.
TRIX performs well when the market is trending. Additionally, TRIX functions extremely well with other indicators like RSI, MACD, and RVI. It is preferred to pair any of these indicators with TRIX to receive effective trading signals.


