The Relative Vigor Index (RVI) was created by John Ehlers, a prominent trader, and author of several books on trading and technical analysis.
Ehlers developed the RVI in the 1990s as a way to measure the strength of a trend and identify potential trend reversals.
The RVI is a popular technical oscillator used by traders to confirm the direction of a trend and to identify potential entry and exit points in the market.
In this article, we’ll look at the important characteristics of the RVI indicator, how it’s calculated, and the trading strategies for profitable future trading prospects.
What is Relative Vigor Index?
The Relative Vigor Index, also referred to as the RVI indicator, is a momentum indicator used in technical analysis. It evaluates a security’s closing price about its trading range to determine the trend’s strength while smoothing the outcomes using SMA (Simple Moving Average).
The usefulness of the Relative Vigor Index is predicated on the observed propensity of prices to close higher than they open in uptrends and lower than they open in downtrends.
The Relative Vigor Index depicts three lines:
- Neutral level (the horizontal dotted line)
- Relative Vigor Index (RVI) line
- Signal Line
There are some trading platforms, that display the index as a combination of two lines – red line and green line. The green line exhibits the RVI line, and the red line exhibits the signal line. Some traders add the neutral line employing the horizontal line. The price chart below illustrates the RVI indicator on the EUR/USD chart.
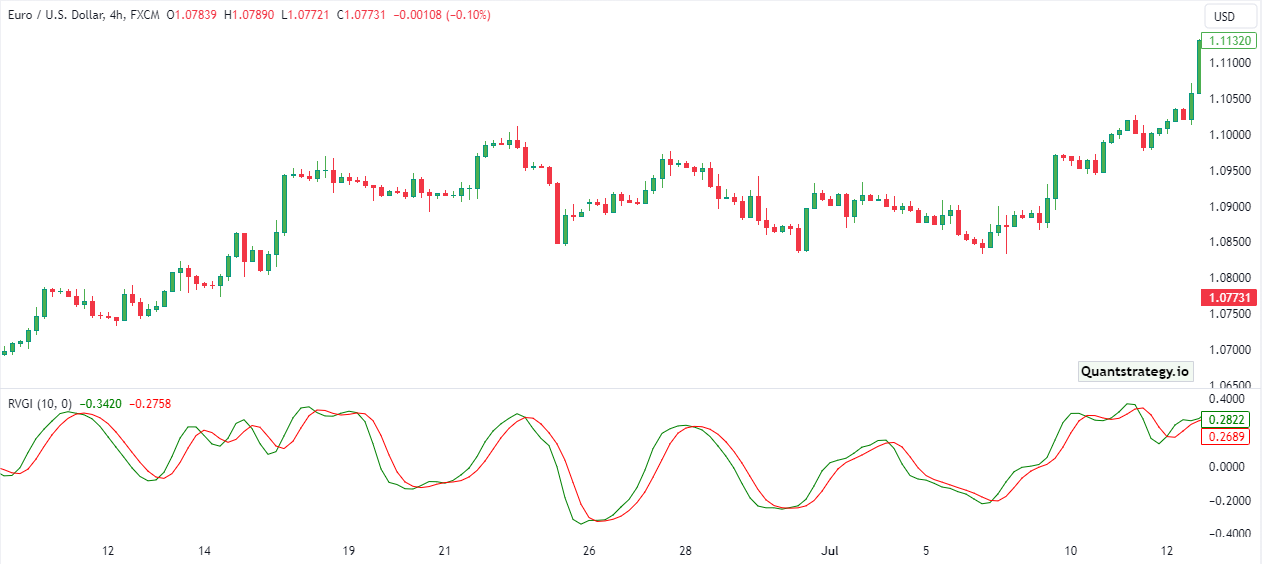
Traders employ the Relative Vigor Index to identify an asset price in overbought and oversold conditions. Overbought levels indicate selling opportunities or going short, while oversold levels signal buying opportunities.
As with all other indicators that involve such lines, traders keep an eye on two main parts in RVI. One is when the two lines cross the neutral line, and the second is when the RVI indicator and signal lines cross one another.
The Relative Vigor Indicator is based on the straightforward idea of comparing highs and lows. This renders it one of the most adaptable oscillators for representing a trend and its alterations.
The Relative Vigor Index Formula
Although the RVI formula appears complex, it is rather simple:
Numerator = (a + (2 x b) + (2 x c) + d)/6,
Denominator = (e + (2 x f) + (2 x g) +h)/6,
RVI = SMA of Numerator for N periods/SMA of Denominator for N periods
Signal Line = (RVI + (2 x j) + (2 x j) + k)/6
Where:
- a = Close−Open
- b = Close−Open One Bar Prior to a
- c = Close−Open One Bar Prior to b
- d = Close−Open One Bar Prior to c
- e = High−Low of Bar a
- f = High−Low of Bar b
- g = High−Low of Bar c
- h = High−Low of Bar d
- i = RVI Value One Bar Prior
- j = RVI Value One Bar Prior to i
- k = RVI Value One Bar Prior to j
- N is indicator period.
The aforementioned equation could seem complex, but it can be made simpler by comprehending how calculations work.
Calculating the Relative Vigor Index
- Select an N period to investigate.
- Determine the current bar’s open, high, low, and closing values.
- List the open, high, low, and close values for the lookback intervals that came before the current bar.
- Evaluate SMAs for the Numerator and Denominator across the N period.
- Divide the values of the Numerator and Denominator.
- Incorporate the outcome into the signal line equation and graph it.
If this calculation seems challenging to you, don’t worry—most trading charts offer the option of quickly displaying the relative vigor index at a single click. Even in that case, comprehending the math can help you grasp how it operates.
How to Use Relative Vigor Index (RVI) in Trading?
Various trading strategies are based on the Relative Vigor Index, as is the case with Relative Strength Index and other technical analysis indicators. Most of them revolve around either crossovers or divergence.
Crossovers
Different kinds of signals are generated when the RVI oscillator merges with the signal line, such as:
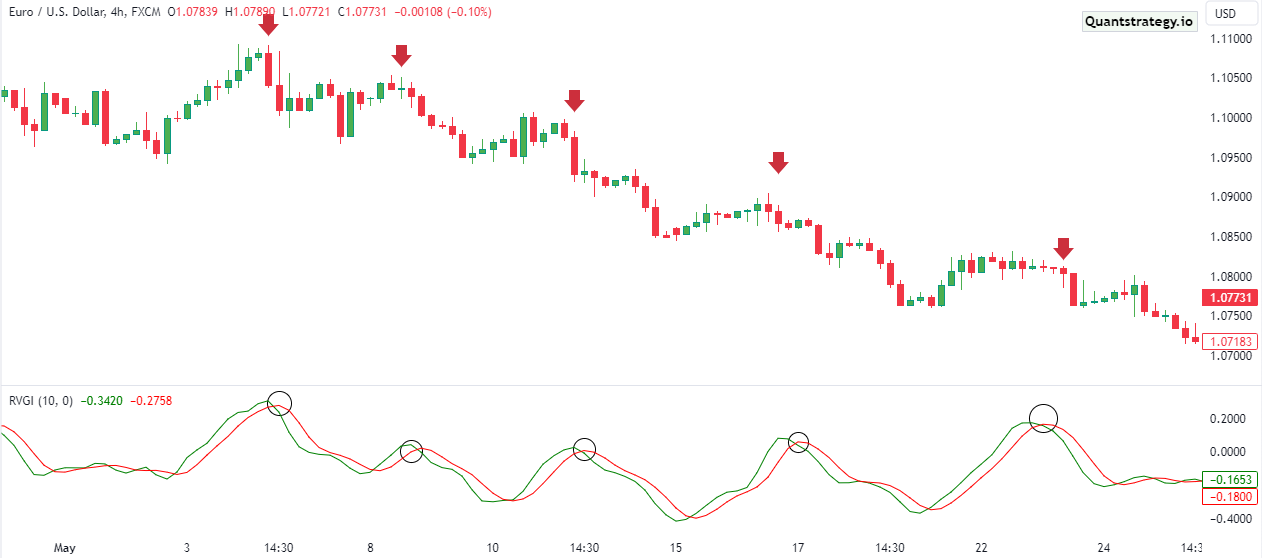
Bearish RVI Crossovers
The RVI crossover is quite similar to the line segments crossing between two moving averages. These crossovers are intended to serve as leading indicators for prospective price direction.
We look at the trend first. The price must then finish its upward adjustment before we proceed. The sell signal comes into play when a swift green line crosses the red one from above. The higher the crossover is, the stronger the overbought conditions and subsequent downward price movement.
The below price chart for BTC/USD shows a bearish RVI indicator crossover.
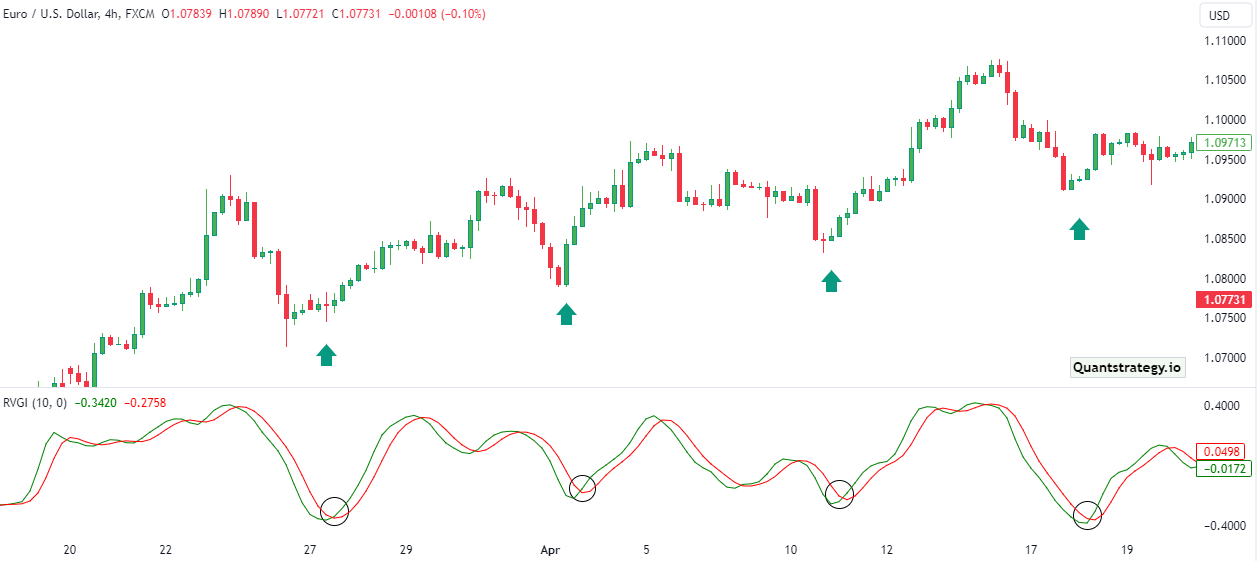
Bullish RVI Crossovers
The same principle applies to movements in the opposite direction.
Check to see if the trend is bullish. When a swift green line crosses the red line from below, it will be our buy signal. If the two lines cross below the zero line, market sentiment is likely to favor opening a long position.
Note: Novices frequently ignore the current trend. Hence, they quickly begin to lose money.
The below price chart for BTC/USD shows a bullish RVI indicator crossover.
Divergence
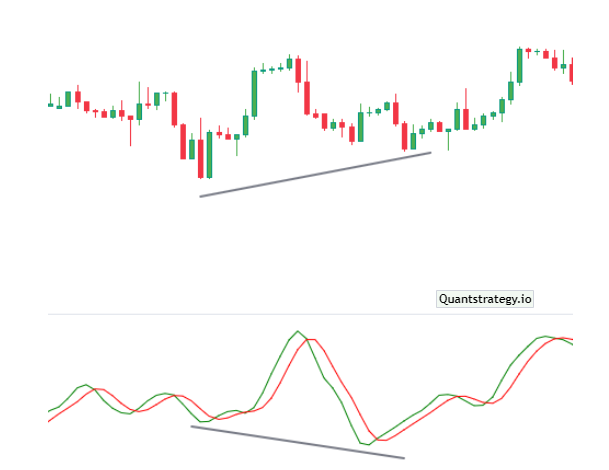
On the contrary, when the Relative Vigor Index Indicator interacts with price action, a bullish and bearish divergence is produced.
If you’ve heard about the Relative Strength Index, then you would probably know how to employ divergences.
A bullish divergence happens when the real price drops to new lows while the lows of the RVI indicator are higher than the prior ones.
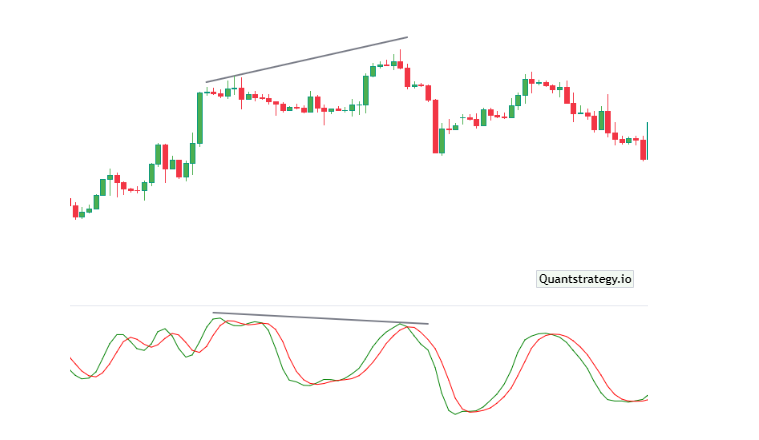
A bearish divergence occurs when the real price attains new highs while the RVI’s highs are lower than the prior ones.
The below chart of BTC/USD illustrates a bullish relative vigor index divergence.
The next chart of BTC/USD illustrates a bearish relative vigor index divergence.
Trading Strategies of Relative Vigor Index (RVI) with Other Indicators
The Relative Vigor Index is a totally independent analytical tool, however, it has sufficient drawbacks. The major problem is that RVI shows false signals. The percentage of such unjustified signals can be reduced by deploying additional trending markets oscillators.
Check the price graph below.
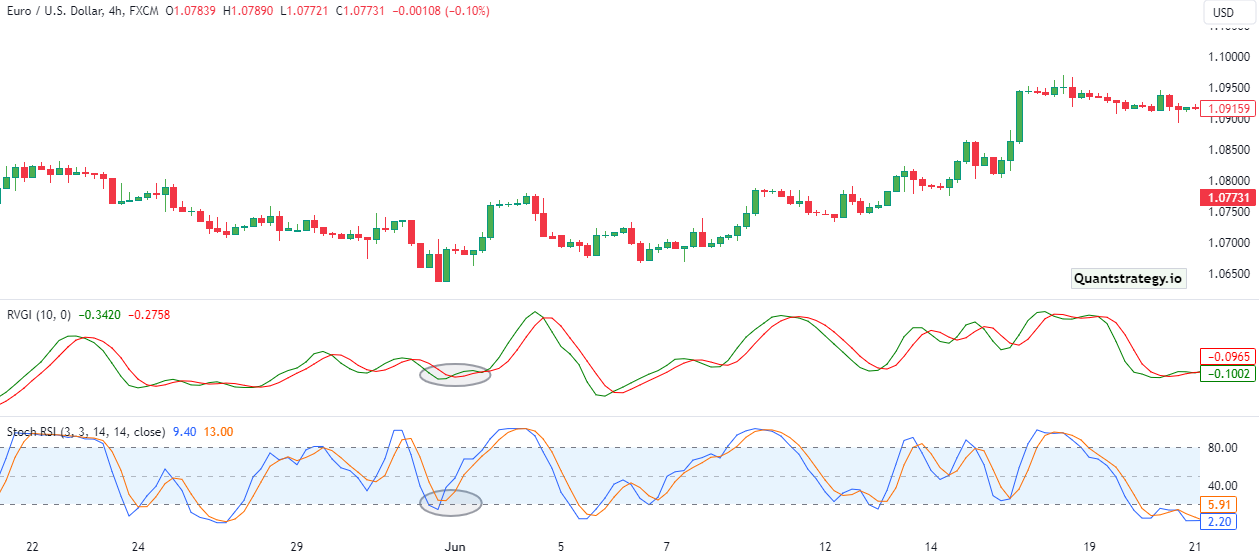
The Relative Vigor Index indicator is used together with the stochastic oscillator in the above illustration. The oversold conditions here are verified by another indicator, minimizing the risk of the move. Other popular indicators such as MACD, Bollinger Bands, or RSI can be used for best outcomes as well.
Weaknesses of the RVI Indicator
The Relative Vigor Index works excellently in trending markets. However, its associated key weakness is that it’s practically useless in range-bound markets when the price action doesn’t shift clearly in an uptrend or downtrend.
As a result, traders usually prefer consulting this indicator when the price movement trades in the uptrend or downtrend for a sustained period in an effort to forecast when the current trend will finish.
Conclusion
The Relative Vigor Index (RVI) is an efficient technical indicator that can be employed for trading all kinds of assets like commodities and currencies. The idea is to employ it with caution as well as ensure to have a clearer knowledge of the economic condition too. This is because the RVI indicator, as like all other indicators is not perfect. It can show false signals during an extraordinarily bullish or bearish condition.
What helps to develop an effective trading strategy is to use it in tandem with other indicators like the MACD, Bollinger Bands, and RSI,. Moreover, proper market knowledge and sound advice for investment can also be useful.


