


Staying one step ahead of the curve is critical for traders and investors in the ever-changing world of financial markets. The Triple Exponential Moving Average (TEMA) is an effective tool that has gained recognition for its ability to produce a smoother and more sensitive portrayal of market trends.
It is a popular price action trading indicator that is used together with other technical analysis tools. It provides signals by applying multiple EMA calculations, rendering it an invaluable resource for traders seeking increased trend analysis in financial markets.
TEMA is derived from the traditional Exponential Moving Average (EMA) to reduce lag and present more accurate insights on trends, support and resistance, and reversals of the stocks.
This article will explore the intricacies of the TEMA along with its formula, benefits, and how it can be efficiently used in the noisy trading market.
What is the Triple Exponential Moving Average?
The Triple Exponential Moving Average (TEMA) is a modified moving average developed by Patrick Mulloy in the mid-1990s. It was created to remove the lag that traders experience when applying oscillators or traditional exponential moving averages (EMAs). This makes it more sensitive and suitable for short-term trading.
Like its predecessor, Double Exponential Moving Average (DEMA), the TEMA overlay employs the lag difference between different Exponential MAs to modify the conventional EMA. But TEMA’s formula employs a triple-smoothed EMA along with the single- and double-smoothed EMAs used in the DEMA formula. The offset formed by these three EMAs results in a moving average that is even closer to the price bars than the DEMA.
The Triple Exponential Moving Average (TE MA) is a trend indicator. It is not as effective in a ranging market. It is most easily employed for trading when trends persist over long periods of time. Longer trends allow analysts to filter out more readily and ignore times of instability. Using the TEMA in conjunction with other technical indicators can assist traders and analysts in interpreting sharp price fluctuations and assessing volatility. Some analysts advocate combining the moving average convergence divergence (MACD) and the TEMA for assessing market trends.
Triple Exponential Moving Average Calculation
The Triple Exponential Moving Average is calculated by applying several calculations to the EMA values. First of all, the trader chooses the time period for the indicator. After that, he calculates the initial EMA. Then, a second EMA called the Double Exponential EMA (DEMA) is calculated from the initial EMA. The last step in TEMA calculation is to take a third EMA from the DEMA. The outcome is a moving average, which responds swiftly to price changes while decreasing noise and delivering a smoother depiction of the underlying trend.
Here is the formula for TEMA calculation:
TEMA = (3 x EMA1) – (3 x EMA2) + EMA3
Where
EMA1 is the initial Exponential Moving Average
EMA2 is the EMA of EMA1
EMA 3 is the EMA of EMA2
Calculation Steps:
- Select a lookback period. This is the number of periods that will be included in the first EMA. With a smaller number of periods, such as 10, the EMA will closely track prices and show short-term patterns. With a longer lookback period, such as 100, the EMA won’t monitor the price as meticulously and will instead display the longer-term trend.
- Calculate the Exponential Moving Average for the lookback period. This is referred to as EMA1.
- Next, calculate the EMA of EMA1, utilizing the same lookback period. For example, if you use 20 periods for EMA1, use 20 in this step as well. This is EMA2.
- Then, calculate the EMA of EMA2, employing the same lookback period as previously.
- Lastly, enter EMA1, EMA2, and EMA3 into the Triple Exponential Moving Average formula to calculate it.
This calculation incorporates a triple-smoothed EMA into DEMA’s lag adjustment approach, but the formula puts more weight on the EMAs with the least lag.
Advantages of Triple Exponential Moving Average (TEMA)
Reduced Lag and Noise in Data
The triple smoothing mechanism of TEMA reduces lag and noise significantly compared to a traditional moving average or Exponential Moving Average (EMA). Therefore, TEMA reacts more promptly to varying market dynamics.
Improved Precision
By adding multiple levels of smoothing, TEMA delivers a more accurate picture of the underlying trend, screening out short-term fluctuations.
Adaptability
Because TEMA responds quickly to changing market conditions, it is ideal for a wide range of trading strategies and time frames.
Integrating TEMA into Trading Strategies
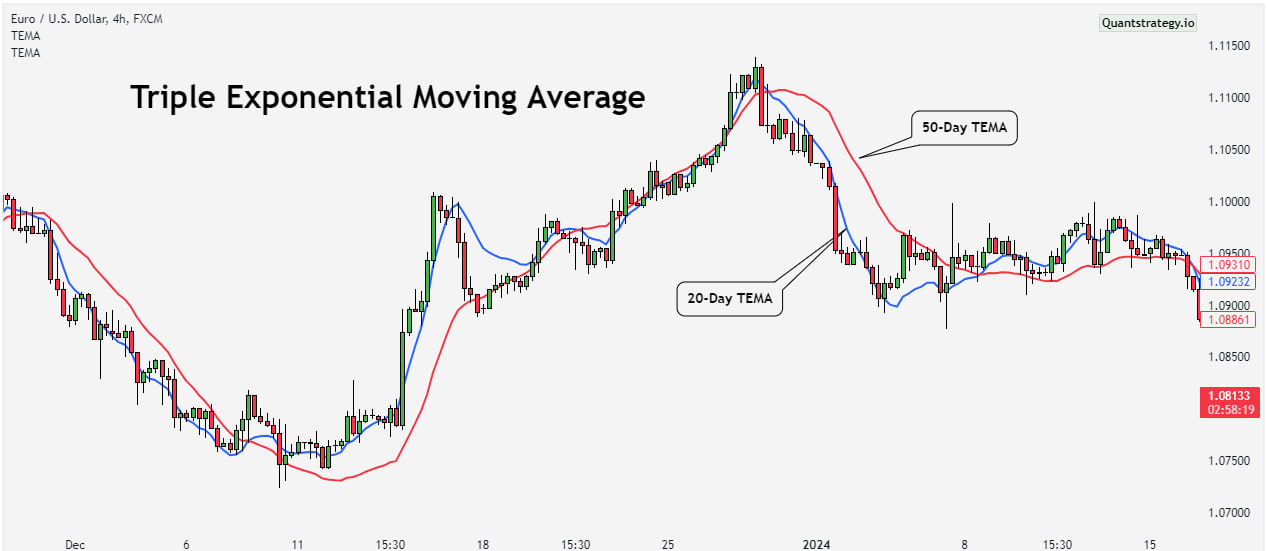
The Triple Exponential Moving Average gives traders useful information on trend direction, crossover signals, and support and resistance levels. Here’s how it can be used in various trading strategies.
Trend Direction
A trader needs to identify market trends to go short or long on a security. Hence, the TEMA helps in spotting trends easily.
Traders can tell if the market is in an uptrend or a downtrend by looking at the slope of the TEMA line. A TEMA line with an upward slope and prices above it indicates an uptrend, suggesting that prices are generally increasing. On the other hand, a downward-sloping TEMA line that links prices below it suggests a downtrend in which prices are generally dropping.
The chart below shows the trend direction of HDFC Bank using the TEMA indicator.
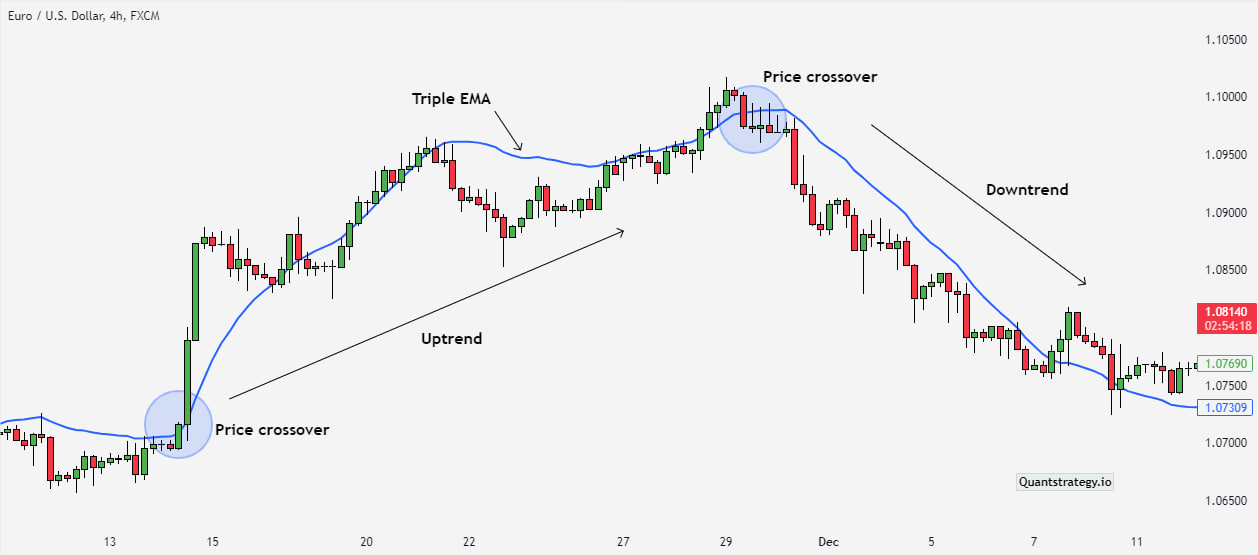
The signals discovered are based on the period specified for the indicator, which may be altered to any of the periods depending on traders’ perspectives and tactics for identifying opportunities in the asset.
Support and Resistance Levels
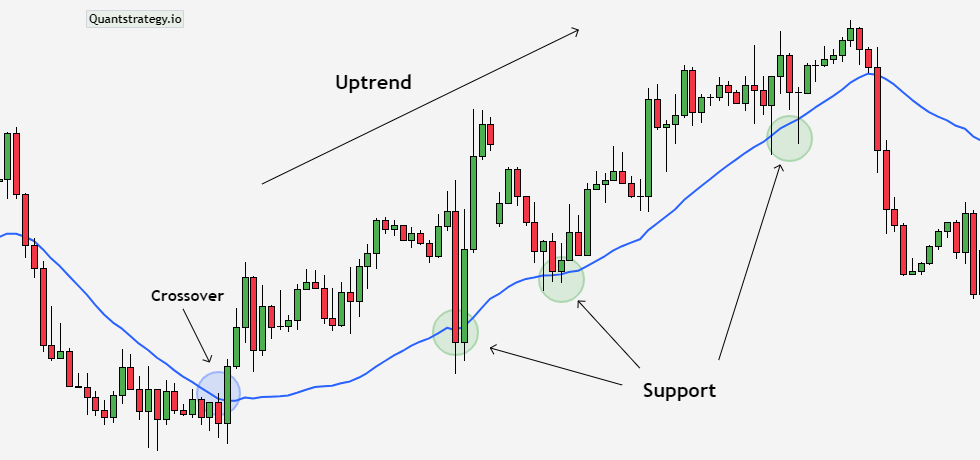
The Triple Exponential Moving Average (TEMA) assists traders in spotting support and resistance for stocks.
When the price of a stock is trading above the TEMA, the indicator supports the pullback. As a result, the Triple Exponential Moving Average serves as a support line for the stock to scale in an upswing.
The chart below shows the TEMA indicator functioning as a support for the BankNifty to climb upwards.
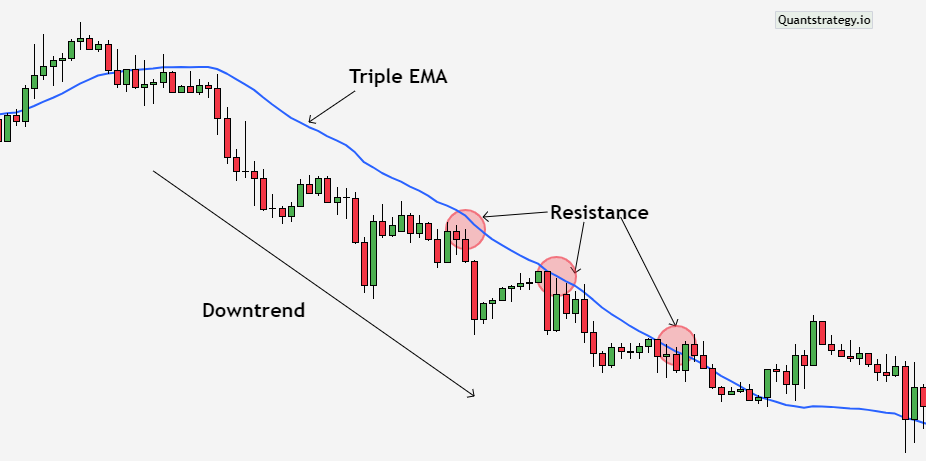
The security’s price will trade below the indicator in a downtrend market. Here, the TEMA works as a resistance line for security. When the price retests the TEMA, it gains momentum towards a downtrend.
The chart below shows resistance acted by the TEMA in a down-trending market for Wipro Ltd.
To make this technique more dependable, choose a specified period based on trader opinions to get smoothed signals.
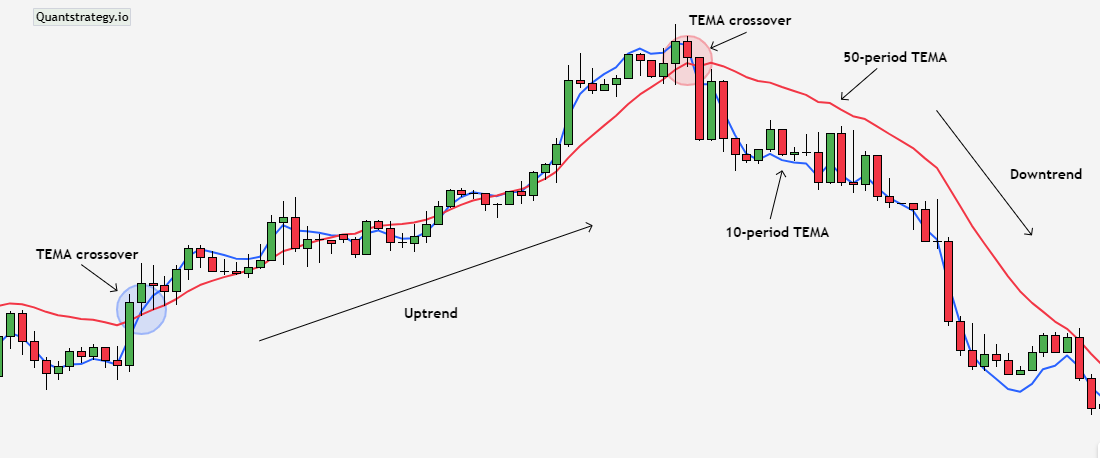
TEMA Crossovers
The crossover of two Triple Exponential Moving Averages is another approach for trading with TEMA. Two TEMAs of 50 as long period and two of 10 as short period are added to the chart of stock.
When the short-term TEMA crosses below the long-term TEMA, it’s considered a sell signal (bullish signal). When the short-term TEMA passes above the long-term TEMA, a buy signal is formed.
The NIFTY 50 chart below illustrates the TEMA crossover approach.
Trend Reversal
As we have learned trend directions with the Triple Exponential Moving Average, it also aids in identifying trend reversals of an asset.
If an asset trading above the TEMA reverses and breaks beneath the indicator, it signifies a trend reversal from uptrend to downtrend.
When an asset trading below the TEMA reverses and breaks above the indicator, it signifies a trend reversal from a downtrend to an uptrend.
Traders can use the trend reversals described above to recognize better entry/exit signals of a stock.
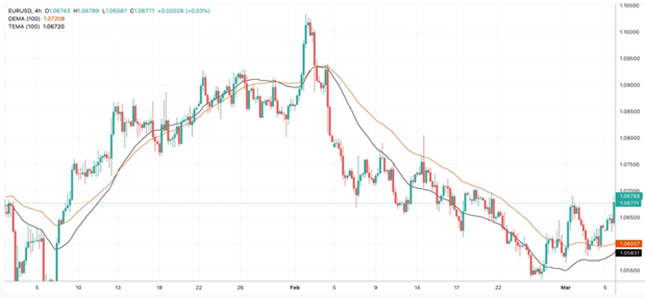
Double Exponential Moving Average vs. Triple Exponential Moving Average
The following are the main differences between Triple Exponential Moving Average (black) and Double Exponential Moving Average (orange):
- Calculation: The TEMA performs the EMA calculation three times, whereas the DEMA only performs it twice. The responsiveness and smoothness of the indicators are affected by this discrepancy in calculation.
- Sensitivity: The TEMA is more sensitive to price changes than the DEMA. This means that, when compared to DEMA, TEMA generates signals earlier in reaction to market fluctuations.
- Smoothness: In general, the DEMA is smoother than the TEMA. It generates a steadier moving average line, which can aid in filtering out short-term price fluctuations.
- Reduced Lag: Both DEMA and TEMA strive to reduce the lag compared to the regular EMA. The TEMA, on the other hand, often has less lag because of its triple calculation.
Limitations of Using TEMA
- TEMA is often helpful in trending markets where the price moves consistently in one direction or the other. The price becomes rangebound in sideways markets, which may cause TEMA to produce false signals. Traders must be cautious at these times because erroneous interpretation of these signals can lead to poor trading selections and financial loss.
- TEMA reacts swiftly to price action, producing crossovers for every tiny price movement, requiring traders to constantly watch their holdings unless a big trend change is observed.
- It serves as a lagging indicator because it is based on historical price data.
- It is beneficial only for current price trends because it cannot forecast future price trends.
Conclusion
The Triple Exponential Moving Average (TEMA) stands out as a handy tool in a trader’s toolbox that provides a finer perspective on market patterns. Its superior smoothing algorithms give traders a clearer picture of price action, allowing them to make more informed judgments. Traders consider its trading strategies and preference for lag reduction when selecting between TEMA and other moving averages. This technical indicator provides price crossovers and other signals faster than DEMAs or conventional EMAs. While the reduced lag and increased responsiveness make it appealing to short-term traders, having some lag on the chart enables filtering out noise. Long-term investors might prefer moving averages with more lag and less noise. Just like any other technical indicator, TEMA should be used alongside other indicators and analytical methodologies.


