


The Williams Fractal Indicator is a powerful technical analysis tool invented and popularized by Bill Williams, the renowned author of the successful trading method outlined in “Trading Chaos”.
This indicator is designed to pinpoint potential trend reversal points, identify strong price levels, and spot local highs and lows (extremums) on a chart.
A breakout from these fractal levels can often signal the beginning of a significant price move.
While Williams himself advised using the Williams Fractal Indicator in conjunction with his Alligator tool, many modern traders have developed distinct and profitable approaches that differ from the original methodology.
This blog post will provide a clear overview of the indicator and explore these varied strategies for trading with it effectively.
What is the Williams Fractal Indicator?
The application of fractal geometry to financial markets, introduced by mathematician Benoît B. Mandelbrot during the 1970s, has its basis in chaos theory, a field of mathematics that investigates intricate and unpredictable systems. According to chaos theory, seemingly unpredictable and chaotic systems, such as financial markets, can display underlying structure and self-similarity via fractal patterns.
Fractals were popularized in trading by Bill Williams, a well-known trader and writer of “Trading Chaos”.
Williams presented the fractal indicator as a component of his bigger trading method, featuring other aspects, such as the Alligator Indicator and the Awesome Oscillator.
He pointed out that just like fractals are any kind of recurring pattern outside trading, you can identify and probably profit from recurring patterns of price movement, which appear across several trading time frames (hourly, daily, weekly, etc.).
Moreover, one of Williams’ primary findings is that fractals can assist traders in predicting probable market reversal points. When a legitimate fractal pattern occurs, the buying/selling pressure balance may shift among traders depending on whether the Williams Fractal
is bullish or bearish, and they may look to profit from a market reversal.
It is mainly a candlestick chart pattern that has been refined over time into an indicator that is obtainable on many trading platforms.
How Does the Bill Williams Indicator
Work?
The williams fractals is based on three key principles.
First, energy in the market takes the course of least resistance. In most circumstances, a falling currency pair or stock will continue to fall until it encounters a powerful opposite energy.
In addition, you will always abandon a trade when the agony of losing a dollar is greater than the agony of losing an additional dollar.
Second, the route of least resistance is defined by the market’s underlying and hidden structure.
Finally, this hidden underlying structure can be uncovered and changed.
The Key Elements of an Asset’s Structure
Most notably, Bill Williams discovered four key structural aspects of an asset when designing the fractal indicator. The four elements are the portions or elements of the trade, plan, purpose, and power source.
To be fair, traders shouldn’t strive to comprehend all of these principles. Instead, they should simply understand how and when to apply the indicator correctly.
How to Identify Bill Williams Fractals on the Chart?
Bill Williams Fractals, which can be observed on both bar and candlestick charts, are made up of the price movement that occurs throughout five candlesticks. The precise amount of time necessary to generate fractals varies based on the charting time frame used by the trader. A fractal may develop in five hours for a trader utilizing the hourly chart, whereas a trader using the daily charts will observe fractals form over five days.
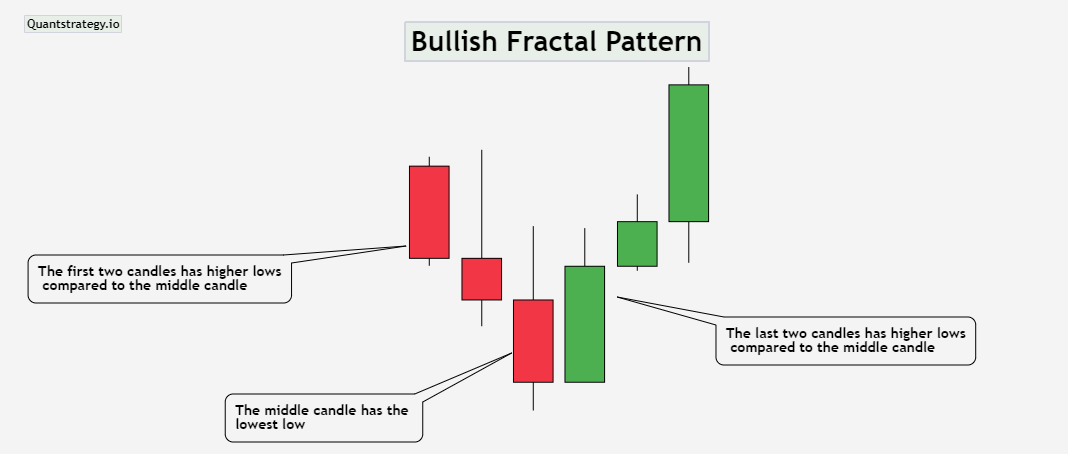
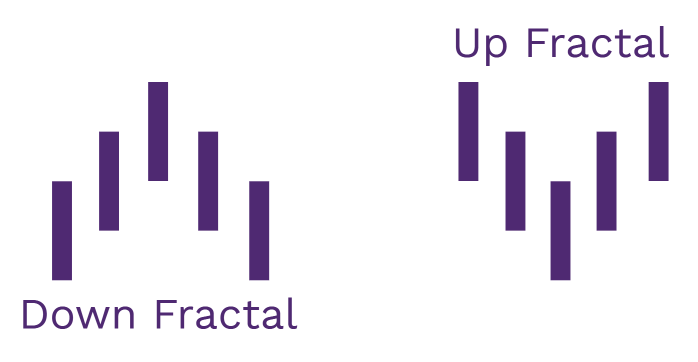
So, what does Bill Williams’s Fractal Indicator look like? One of its advantages is that it is relatively simple to identify on a chart. There are two fractal forms – bullish and bearish patterns. Bullish fractals signify a forthcoming uptrend reversal. Look for a sequence of five candles on your price chart to find it. The third candle should have the lowest low.
This signals a probable reversal point. The first two candles in the pattern must have higher lows than the middle candlestick. Finally, the final two candles must also have higher lows that further confirm the increasing bullish momentum.
The below chart depicts how it appears on the chart:
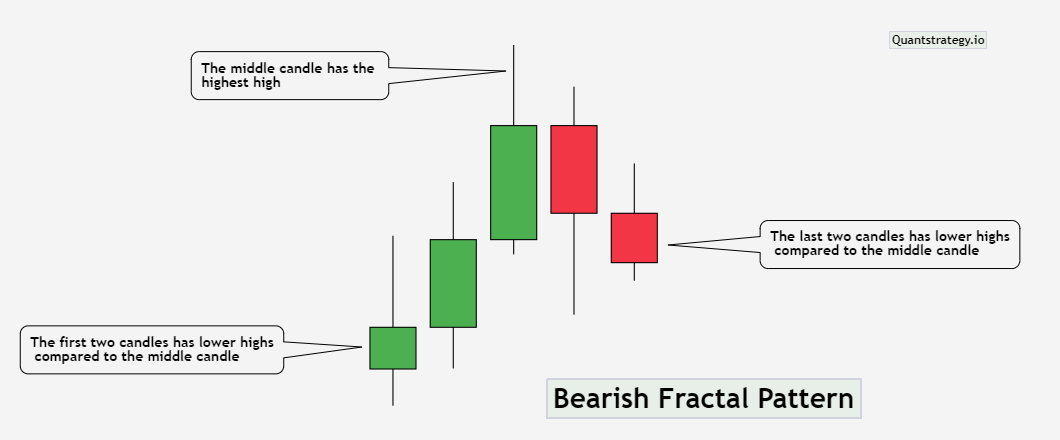
On the other hand, bearish fractals indicate an impending downtrend. Here is how you can recognize it:
Begin by identifying the set of five candles. The third candle must have the highest high in this situation, which suggests a potential trend reversal. The first two candles in the set must have lower highs compared to the middle candle. Finally, the remaining two candles should continue the pattern by producing lower highs.
See the chart below for an example.
It’s worth noting that the color of the first and second candles has no bearing on identifying the fractals indicator. A bullish fractal, for example, can have a bullish candle preceding a bearish candle shortly before the middle candle and still be a valid bullish fractal as long as the lows are higher than the low of the middle candlestick.
Another way to understand the Bill Williams Fractals Indicator is as follows:
-
A bearish fractal, indicating a market reversal to the downside, occurs when each of three successive candles shows the price reaching a higher high, followed by two candles displaying price movement with a lower high compared to the high of the preceding candlestick.
-
A bullish fractal, indicating a market reversal to the upside, occurs when each of three successive candles shows that the price moves to a lower low, followed by two candles that display price movement with a higher low compared to the low of the preceding candle.
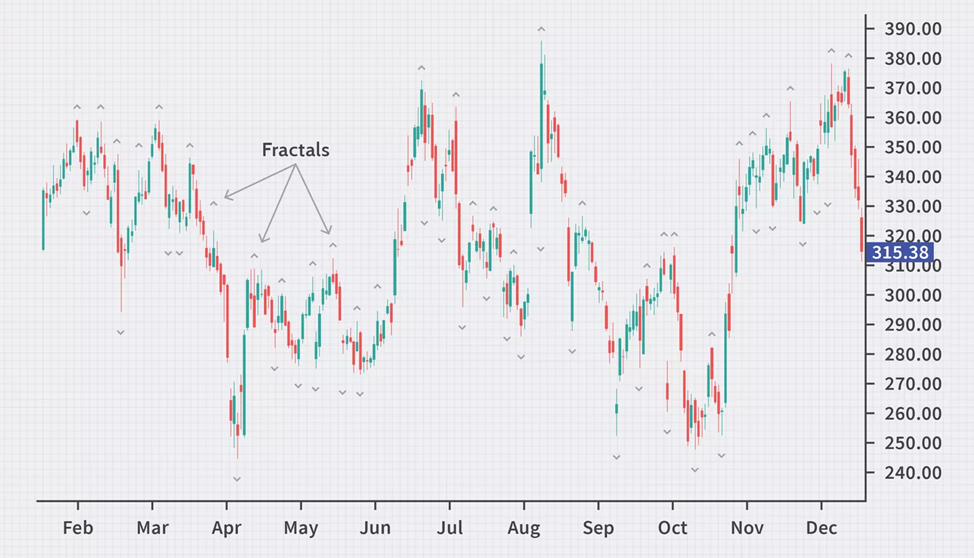
Moreover, a bearish fractal is also referred to as an up fractal and is usually depicted with an up arrow (upward pointing) above it on a chart. Conversely, a bullish fractal, also called a down fractal, is shown with a down arrow (downward pointing) below it.
As a result, if you’re employing fractals during an upward trend, look for downward-pointing fractal arrows. When seeking trading chances with bearish fractals in a downward trend, search for upward-pointing fractal arrows.
Fractal Indicator Caution
Bill Williams fractal indicator must be verified by the close of the fifth candle. In other words, you must wait until the fifth candlestick closes to see if a real fractal has developed. The inability of a fractals indicator to fully develop can be an indication of a likely future price change.
Assume that four of the five candles forming a bearish fractal have emerged, but the price action depicted by the fifth candle, rather than demonstrating a lower low than the fourth candle, instead displays the price progressing to a new high, even well over the high of the third candle in the developing pattern. Such price action will not only rule out the construction of a bearish fractal, but will also indicate that the current uptrend is going to persist, and the price will continue to rise to higher levels.
Calculation of Bill Williams Fractals Indicator
The Bill Williams fractal indicator is not calculated in the same way as other indicators. Unlike most, the Bill Williams Fractals formula is more akin to an If statement. An If statement can be considered similar to a flow chart – if X occurs, do Y.
As a result, we can describe the computations of a bullish Williams Fractal as follows:
Bullish Fractal = Low[n] < Low[n-2] and
Low[n] < Low[n-1] and
Low[n] < Low[n+1] and
Low[n] < Low[n+2]
And bearish Williams Fractal as:
Bearish Fractal = High[n] > High[n-2] and
High[n] > High[n-1] and
High[n] > High[n+1] and
High[n] > High[n+2]
Where:
n = the high or low of the current price bar
n -2 = the high/low of the price bar two periods to the left of n
n – 1 = the high or low of the price bar one period to the left
n +1 = the high or low of the price bar one period to the right of n
n + 2 = the high or low of the price bar two periods to the right of n
Calculating fractals requires more visual acumen than math.
-
Select the highest or lowest point (n) on the chart.
-
A probable pattern exists if there are two lower highs towards the left of the high or two higher lows towards the left of the low (n-2 and n-1). Two more price bars on the right are still required to validate the pattern.
-
If two lower highs emerge after the high, a bearish fractal (n+1 and n+2) is complete. A bullish fractal is complete if two higher lows emerge after the low.
How to Use Bill Williams Fractal Indicator in Trading
Now that you have understood how to identify and calculate a fractal on the chart, let us observe how to trade it profitably. It is noteworthy that there are various ways to trade this pattern, but the following are the most effective trading strategies.
RSI and Fractal Trading Strategy
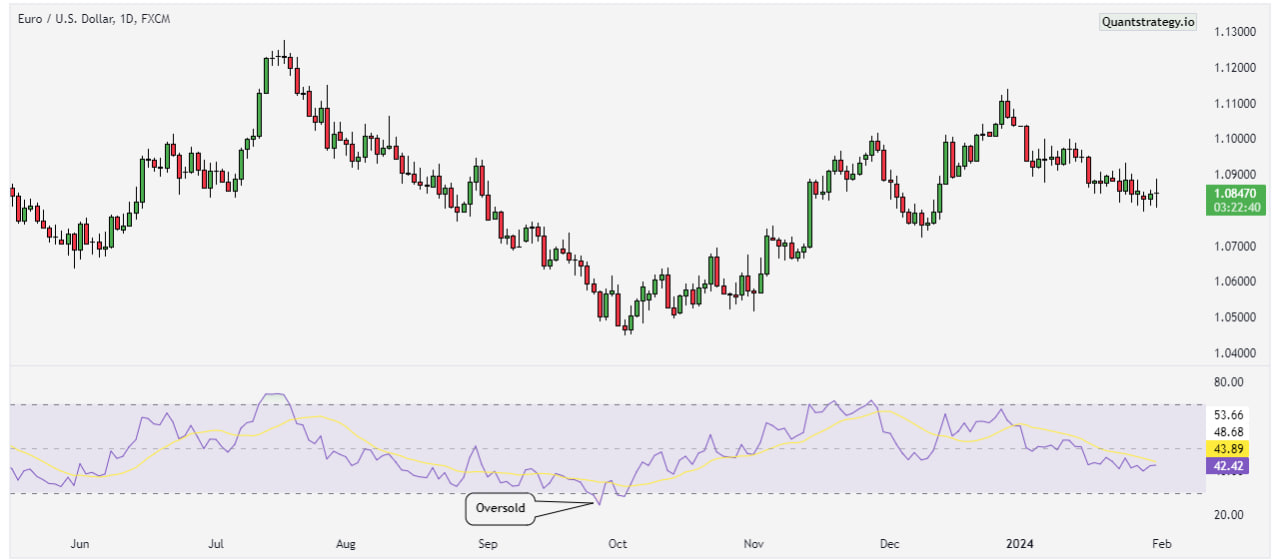
Combining the fractal with the RSI indicator is one of the simplest ways to trade it. The RSI indicator is good at indicating where price reversals are probable to occur, and coupled with the fractal sequence, we may profit from the new move.
The first stage is to determine overbought or oversold areas on the RSI. These points indicate a possible trend reversal. For example, the chart below shows an oversold market, which indicates that sellers are exiting the market and an uptrend will shortly begin.
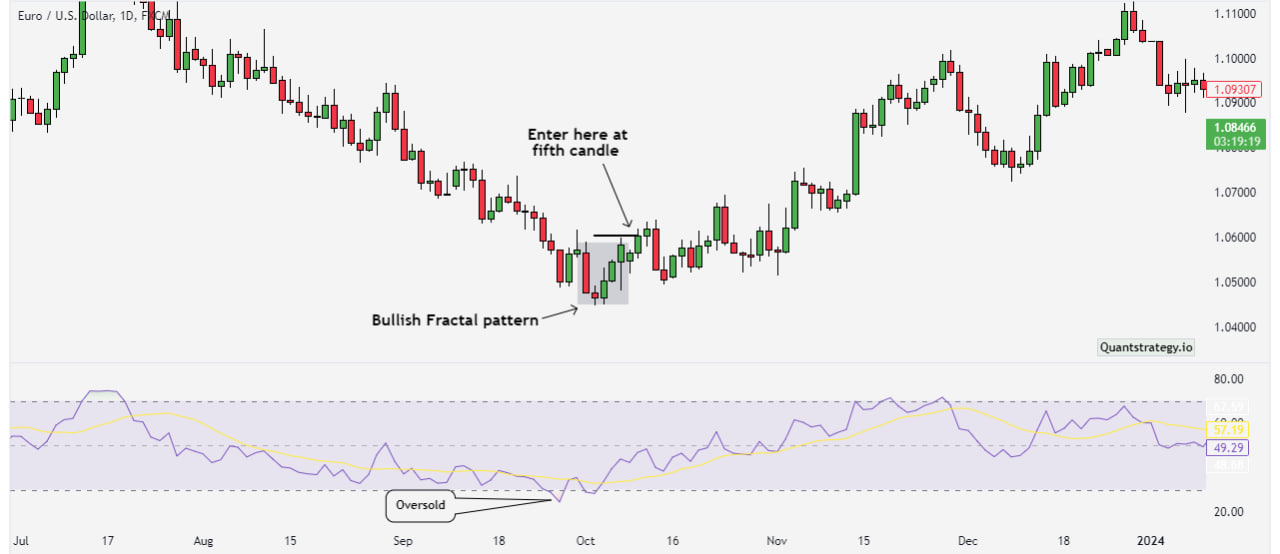
After determining that the market is oversold, we’ll seek a buy entry near the close of the fifth candle of the bullish fractal, as illustrated in the chart below.
Knowing where to buy isn’t enough; we also need to be aware of our risk management parameters since this isn’t a fail-safe strategy.
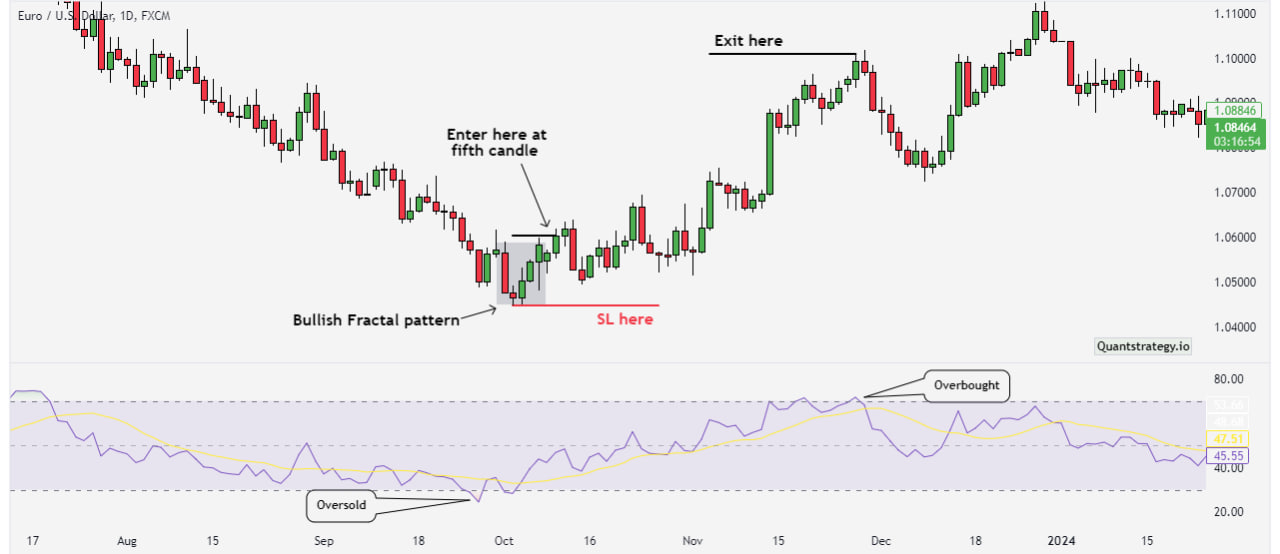
In this situation, we will set our stop loss just below the bullish fractal formation and exit the trade when the RSI reaches overbought. If you favor a “set and forget” strategy, set your target profit to twice your risk after setting your stop loss under the bullish fractal formation.
Alligator Indicator and Fractal Trading Strategy
The fractal indicator should always be checked and filtered using other technical indicators, and Williams, naturally, recommends the Alligator indicator. This indicator employs the 13, 8, and 5 smoothed simple moving averages, and when the indicator expands out, it suggests a stronger trend in general.
Bill Williams proposed the following ways to trade the two indicators together.
-
Remember to trade with teeth that is the 13-moving average (colored blue).
-
The moving averages should expand out.
-
If the buy fractal is higher than the teeth, set a pending by order directly above it.
-
If the buy fractal is beneath the teeth, skip it.
-
Set a pending order directly below the sell fractal if it is below the teeth.
-
If the sell fractal is higher than the teeth, skip it.
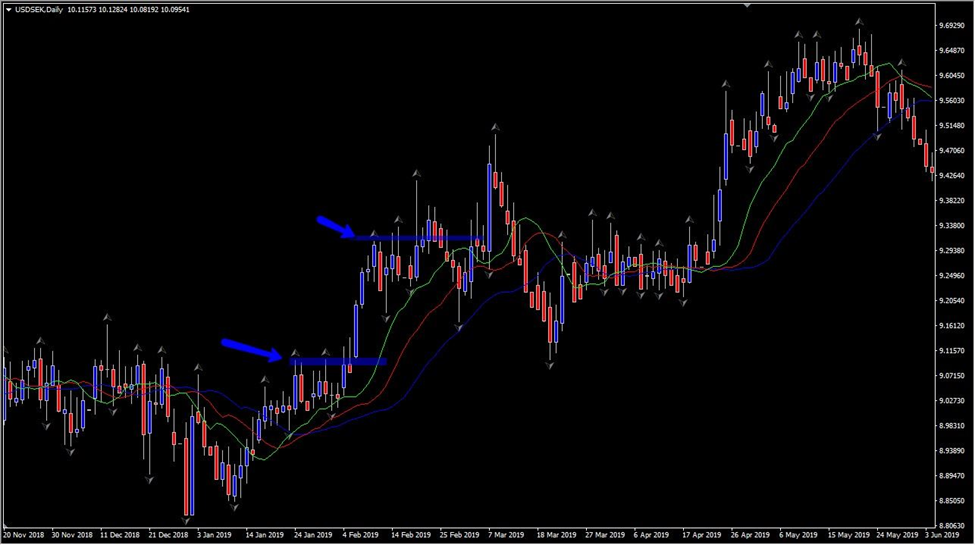
Consider the chart below. Some fractals finally break to the upside, which were signs to begin purchasing. Simultaneously, the alligator was ascending with widely spaced moving averages. This is exactly how Bill Williams would’ve traded this pair. The blue arrows and blue lines at the position of the breakout show the setups.
Fibonacci Retracements and Fractal Trading Strategy
Another way to apply Bill Williams trading system is to pair it with Fibonacci retracement levels. This trading strategy combines the strength of fractal trading as a trend reversal indicator with the accuracy of Fibonacci retracement levels, allowing traders to focus on higher probability trade situations only. This method works as follows:
When you go to the chart, the first thing you’ll want to do is detect the trend. A pattern of lower highs and lower lows characterizes a downtrend. An uptrend is indicated by a succession of higher highs and higher lows.
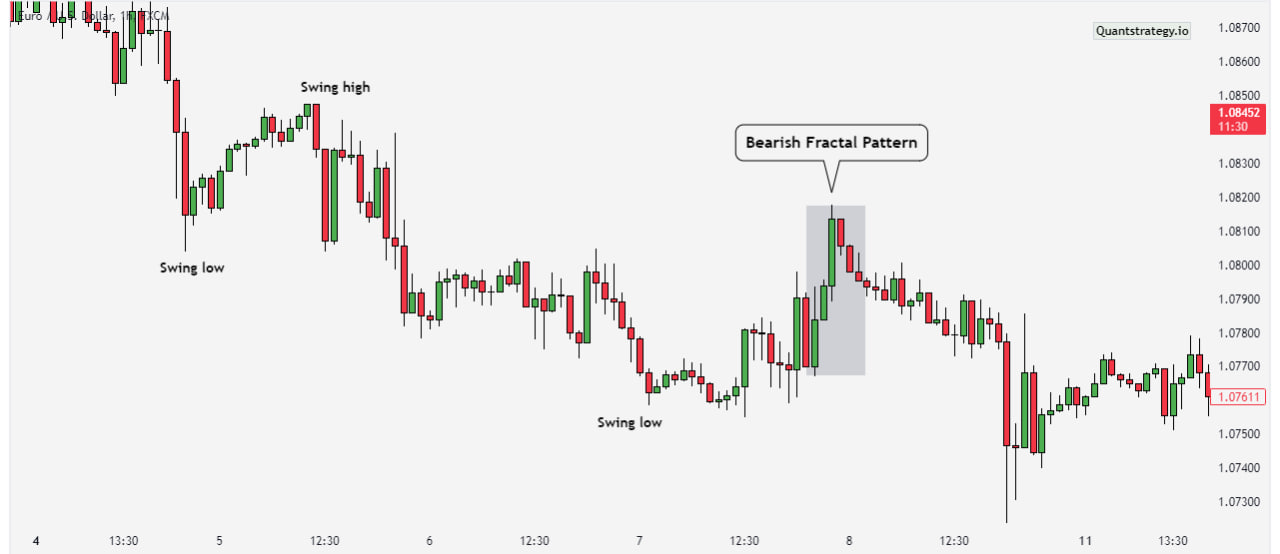
The above chart clearly shows that the trend is bearish, and all we need to do is search for a bearish fractal.
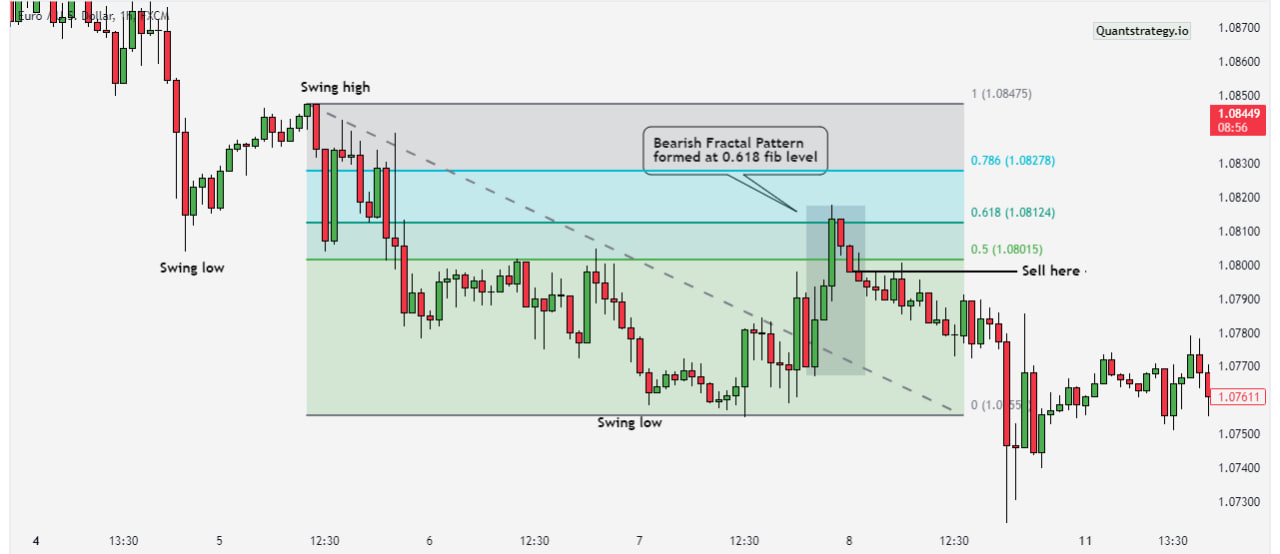
After spotting the bearish fractal structure, a Fibonacci retracement confluence should be added. Draw the Fibonacci retracement from the swing high to the swing low in a downtrend. The pattern must be retesting important Fibonacci retracement levels (e.g. 61.8%) to be a valid entry signal, as illustrated in the chart above. Then, after the fifth candle closes, open a position.
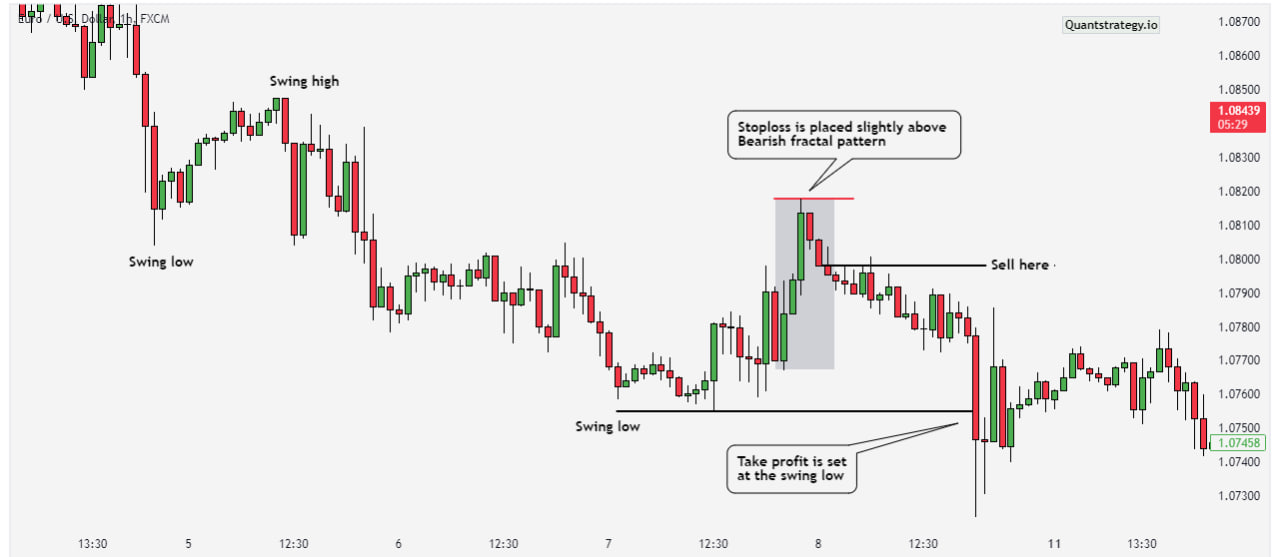
Now, because we are engaging in a short-sell position, set a stop loss just above the fractal and set your profit target to the swing low of the move, as indicated in the chart above. If we were in an uptrend, the opposite would be true. That concludes this strategy!
However, it is recommended to backtest each of these trading strategies to determine which works most effectively for you before trading them with actual cash, as this helps you create trust in the system and maintain a good trading psyche.
Fractal Trading – Advantages and Disadvantages
Fractal trading, like any other trading strategy, has advantages and disadvantages. Let’s look at both sides of the coin to get a full picture of its use.
Advantages
-
Bill Williams fractals can be used to create support and resistance levels.
-
Fractal patterns send out early entry cues. A trade is entered when the price breaks out of the zone of fractal accumulation.
-
The fractal indicator shows levels for Stop loss placement.
-
Williams fractal can be used in several time frames, making it suitable for traders with a variety of trading styles and preferences.
Disadvantages
-
Bill Williams fractal can only be used in a trending market.
-
The fractals indicator generates many false signals and should not be utilized as a primary tool for market analysis.
-
It is inefficient at short timeframes due to market noise.
Conclusion
Bill Williams is widely regarded as the “Father of Modern Technical Analysis,” and his contributions to the field cannot be underestimated. The Williams Fractal is a distinct indicator that looks different from most other indicators, but if a trader understands what fractals do and how they give signals, they will have no trouble incorporating it with other indicators. While it may not stand out on its own, it can be an excellent addition to any trading strategy.
Backtest Library
Forget guessing how an indicator might perform; our instant backtesting data gives you the answers.
We’ve done the heavy computational lifting so you can focus on making informed decisions.


