

Scalping has evolved as a popular approach among traders hoping to gain on small price fluctuations in the fast-paced world of trading, where milliseconds may make or break a trade. It is the practice of making quick, tiny trades to profit from intraday market volatility. To successfully navigate this fast-paced environment, scalpers frequently rely on a set of indicators that provide insight into market dynamics.
These indicators enable scalpers to make quick decisions based on probable price patterns. In this blog post, we will look at some of the best indicators for scalping trading strategies, discussing their value and how to apply them successfully.
How does Scalping Trading Work?
Scalping is a type of trading that entails employing short timeframes to profit from small price movements. Scalpers are traders who specialize in this trading style.
The concept of scalping is simple: it is less complicated to catch minor moves than it is to catch larger moves. Regular traders seek an average position size having a high-profit percentage. Scalpers strive for a tiny profit percentage in the quickest amount of time while keeping a relatively larger position size by completing many trades. This is because they believe that betting on tiny price movements is less dangerous than betting on massive ones. For example, the price is more likely to move by 5 pips than it’s by 100 pips. Even when it does move by 100 pips, it can take a long time. During this time, however, the scalper has had the choice to take up to 20 pip trades.
Certainly, this is an approximation of how scalping works, nevertheless, it serves our objective of demonstrating the theory of scalping.
Scalpers frequently enter and exit transactions in a matter of seconds or minutes based on changing market movements. They don’t want to be in trades for more than an hour most of the time, as scalpers profit from small price swings from many small wins. They can perform multiple trades on a single trading day. Sometimes, these trades can be over a hundred.
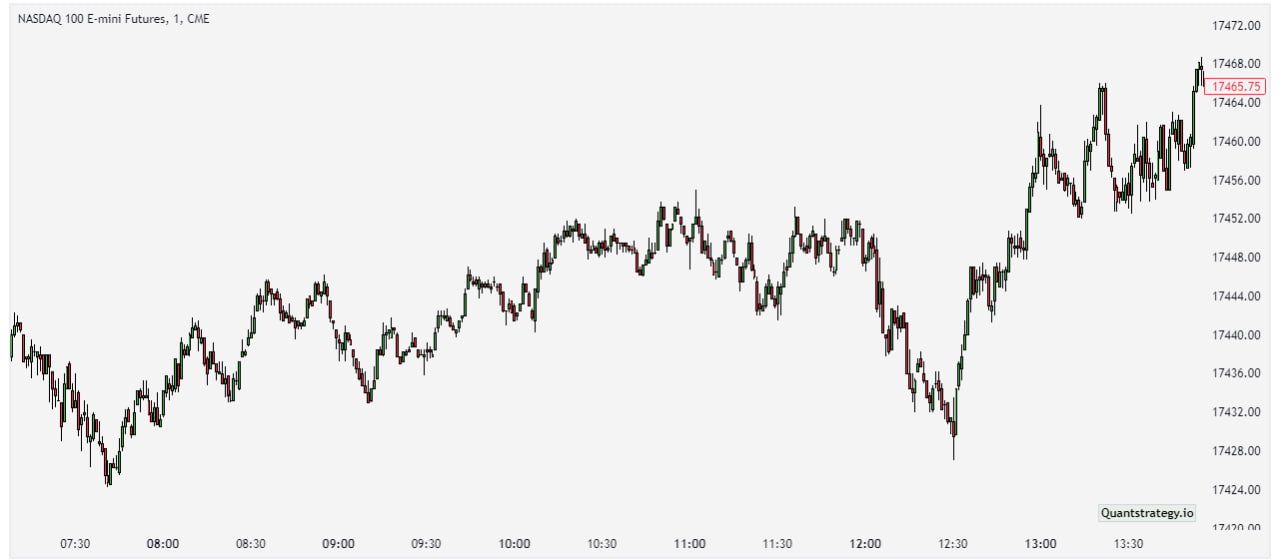
Scalping is accomplished through the use of extremely short-term charts. Most scalpers utilize charts that are shorter than 5-minutes. They then notice chart patterns and place trades according to them.
For example, the chart depicts a one-minute chart of the Nasdaq 100 index. Because the chart is trending, one can initiate a buy trade and continue it until a reversal occurs.
One widespread misconception is that scalpers earn less money. However, they have a better possibility of earning from profitable trades by completing multiple trades. In short, instead of focusing on making significant profits from a limited number of orders, the scalping trading strategy concentrates on making little profits from a large number of transactions.
Why do Scalpers Use Indicators?
A lot of scalpers prefer using indicators as they properly mask one of the scalping’s primary flaws: being too fast-paced.
But how?
Scalp trading is fast-paced. For example, candles on price charts are generated every minute in the 1-minute timeframe. That implies the scalper just has a minute to study the current market situation, determine whether to buy or sell, and place their trades. And, due to the nature of scalping, they can do this as many times as they want during the trading day for as long as their trade setup appears. For many scalpers, this might be difficult to keep up with.
Indicators, on the other hand, are an ideal answer to this problem. Many indicators are unbiased, and they are not susceptible to the interpretations or opinions of traders. As a result, scalpers are relieved of some of the emotional weight and decision-making time. Indeed, this is why many scalpers use meta-trader expert advisors, which automate trade inputs based on indicators. They do not need to be present to make subjective decisions. They can simply program the code to accomplish objective/logical duties for them.
Best Scalping Indicators to Use
After demonstrating why scalpers and indicators are best friends, here are the best 6 scalping indicators available.
Bollinger Bands
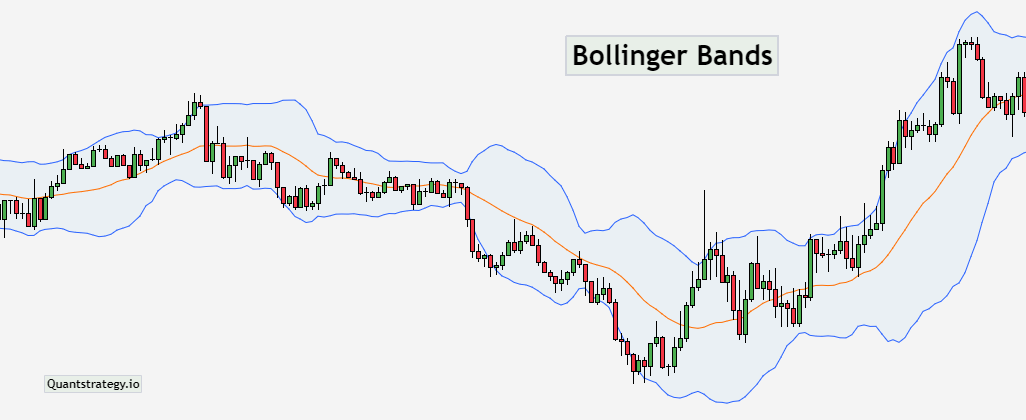
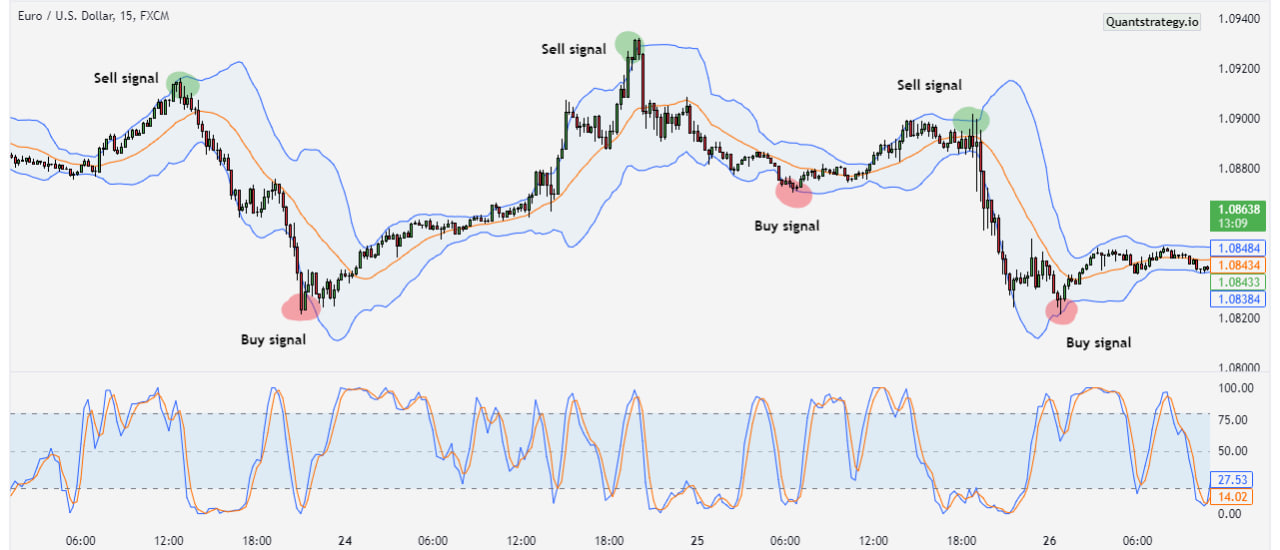
Bollinger Bands are a prominent tool in traders’ toolboxes for measuring market volatility and locating potential entry and exit positions for trading. The indicator demonstrates the trend direction using three lines. The first line is a simple moving average (SMA), while the other two are standard deviation lines, one above and one below the SMA. Based on market volatility, these bands dynamically modify their breadth. When volatility rises, the bands broaden; when it falls, they contract.
The bands depict price volatility and possible price levels where trends may reverse. Traders often use Bollinger Bands to identify overbought or oversold levels and probable trend shifts.
How to Use Bollinger Bands?
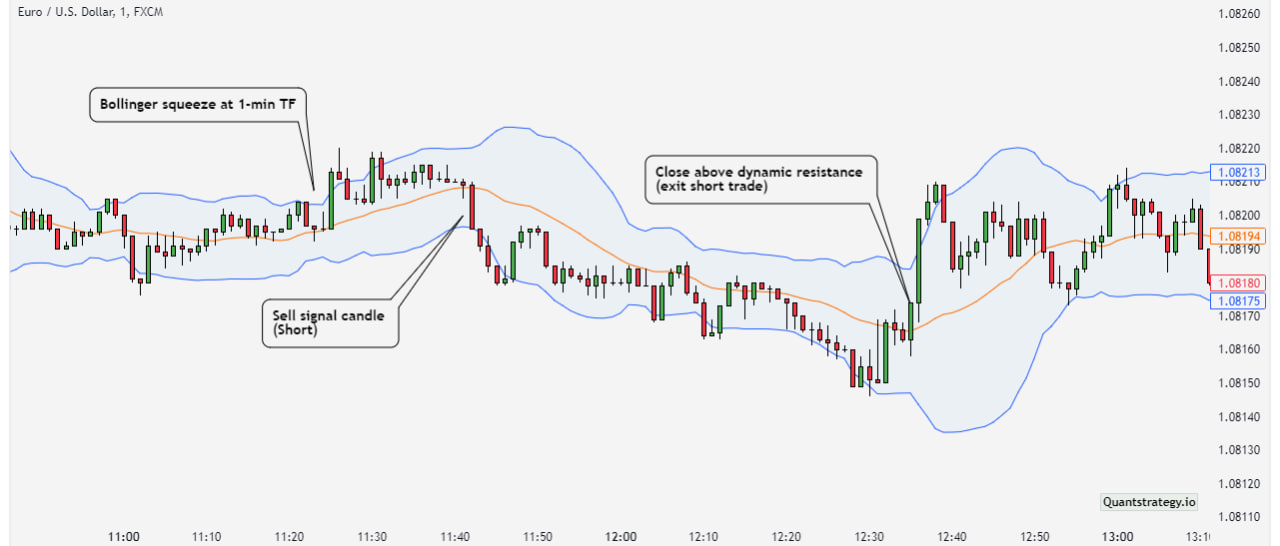
Bollinger Bands are useful for indicating entry and exit points. Price approaching or crossing the upper band can indicate overbought conditions, which possibly signals an impending price decline or reversal. When the price touches or breaks the lower band, it may indicate an oversold situation and could be an early indicator for a reversal or bounce.
Furthermore, a Bollinger Bands squeeze happens when the bands narrow, signaling a period of low volatility that frequently precedes a large price movement. Traders look at this squeeze as a potential entry point. When the bands rapidly widen following a squeeze, it can indicate the beginning of a breakout or a new trend, prompting traders to look for an entry point.
Exit points can be selected when the price action following the squeeze loses momentum or hits the dynamic resistance level.
Relative Strength Index (RSI)
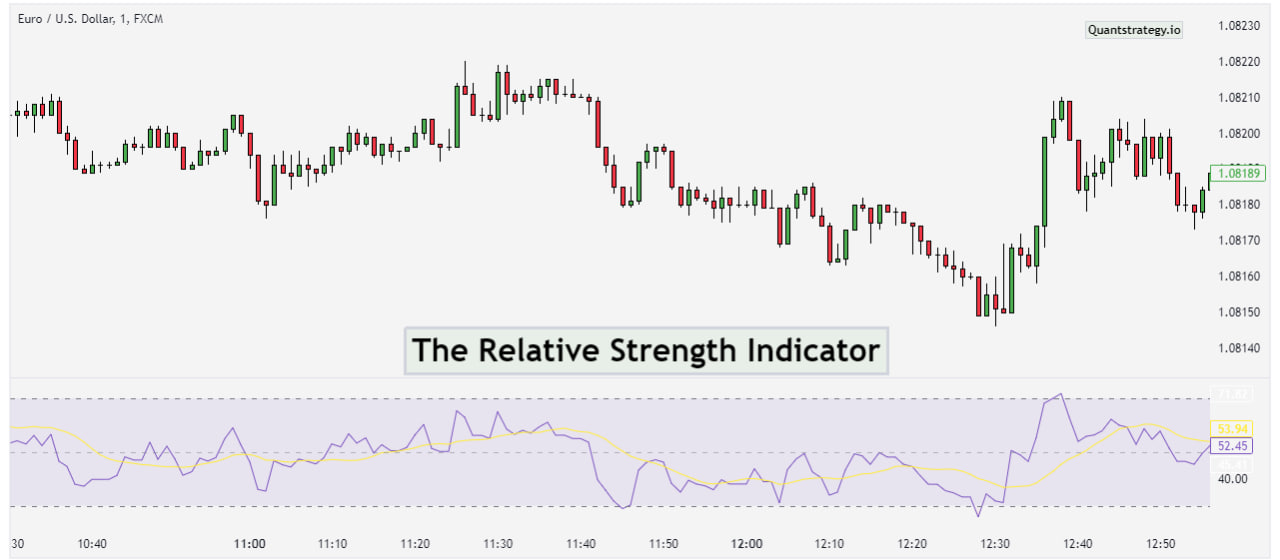
The Relative Strength Index is one of the most often used indicators. And for scalpers who depend on indicators, it’s a must-have tool. This scalping indicator evaluates how quickly the price of an asset changes. This information is used to assess whether the asset is under too much purchasing pressure (overbought) or too much selling pressure (oversold).
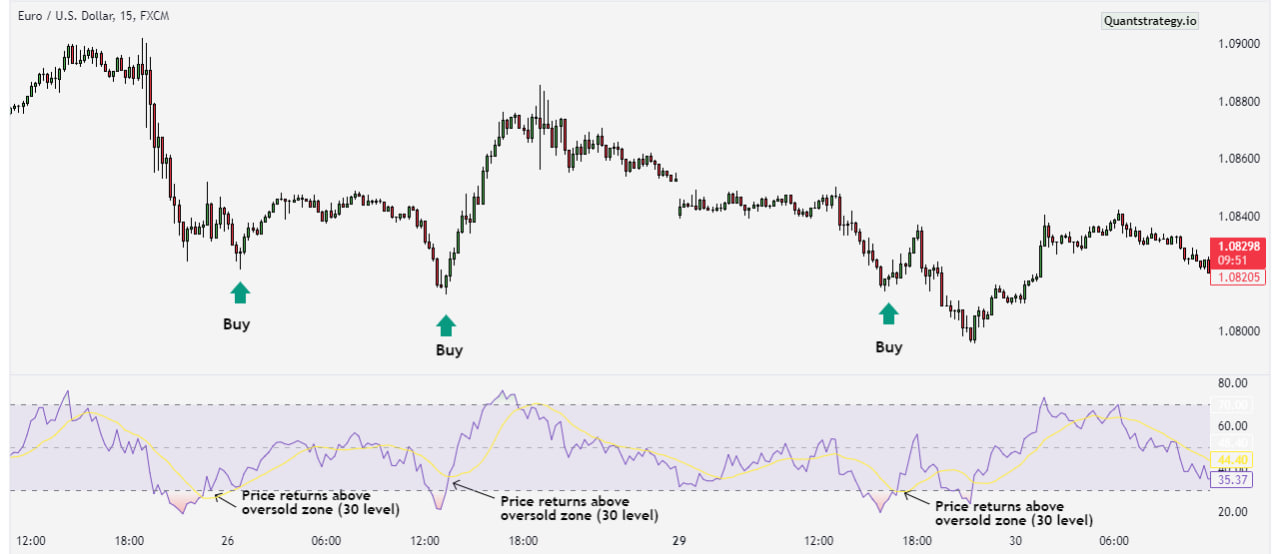
By default, the RSI indicator oscillates between 0 and 100. However, when it exceeds 70, the asset is termed overbought. And, it is oversold when it falls below the 30 level.
Apart from identifying overbought and oversold conditions, RSI also aids in finding price and momentum divergences, providing insight into prospective trend reversals. Finally, it is vital to highlight that the RSI does not compare different assets. Instead, it evaluates the asset’s power based on its prior prices rather than the entire market.
How to Use RSI?
Many scalpers depend on the RSI to trade reversals in overbought and oversold situations. When the indicator exceeds 70, a price reversal to the negative is anticipated. When the indicator falls into the oversold level (below 30), a price reversal to the positive is anticipated.
Go short or exit a trade when the indicator rises above 70. Conversely, when the indicator falls below 30, it can be a long trade and buying opportunity. However, depending just on these levels may result in erroneous indications. Traders frequently wait for the RSI indicator to reverse direction before moving, or they evaluate divergences between the RSI and price swings. Furthermore, combining RSI with other indicators can help refine decisions and increase the precision of entry and exit trading strategies.
Exponential Moving Average (EMA)
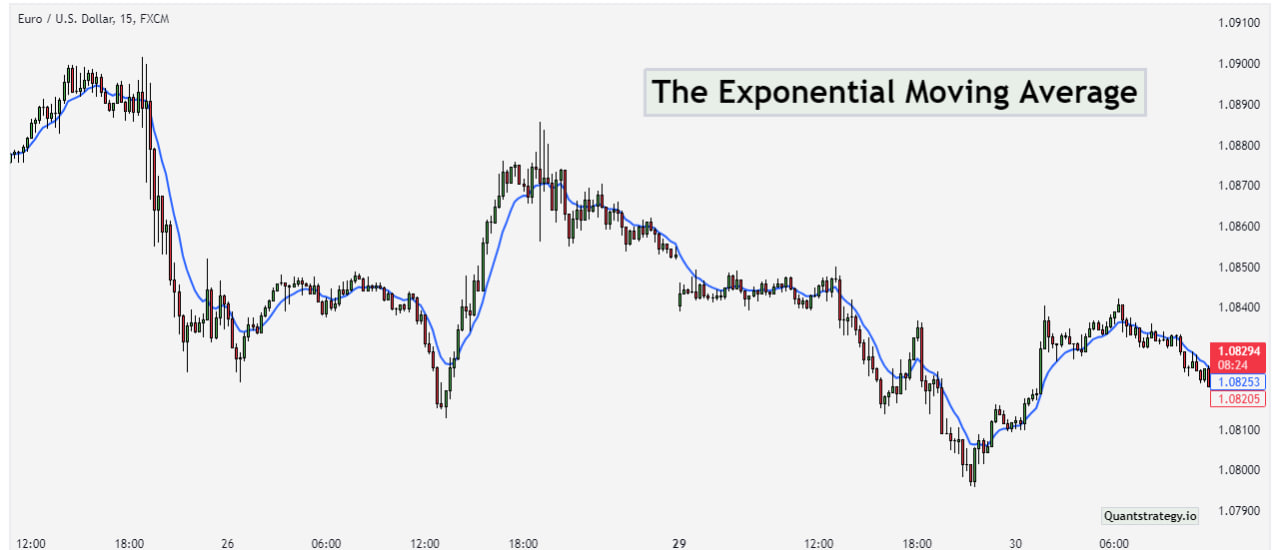
The EMA indicator is a type of moving average (MA) that prioritizes the most recent data points. Unlike SMA, which considers all data points equally, the EMA responds more strongly to recent price changes. The EMA’s weighting approach improves its capacity to capture emerging trends quickly, rendering it useful among traders looking for up-to-date information.
Its versatility to multiple timeframes and circumstances adds to its attractiveness, assisting scalpers in successfully tracking emerging patterns.
How to Use EMA?
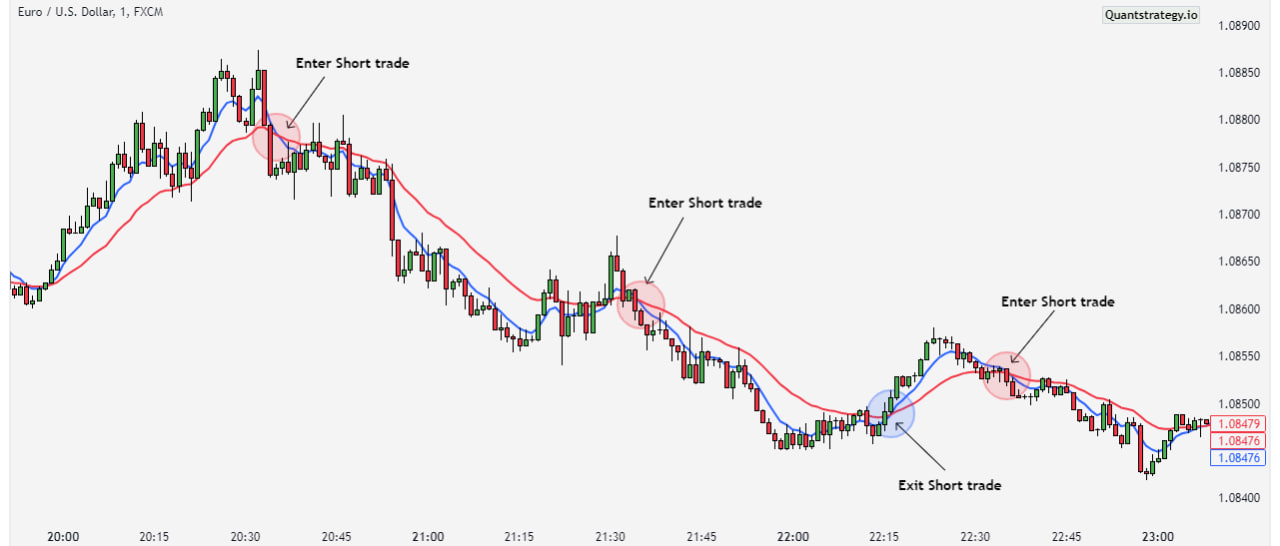
EMA acts as a reference for entry and exit points. Traders frequently concentrate on EMA crossovers, which occur when a shorter EMA crosses a longer EMA. When the shorter EMA passes above the longer one, it may signal a possible uptrend and a good moment to enter a trade.
In contrast, a shorter EMA passing below a longer EMA can suggest a probable downtrend and a good time to exit or explore short positions. Combining EMA signals with other tools, such as support and resistance levels, improves traders’ accuracy in timing transactions.
Moving Average Convergence Divergence (MACD)
This scalp trading instrument is a momentum indicator that largely relies on EMAs for calculation, making it a good trend trading indicator.
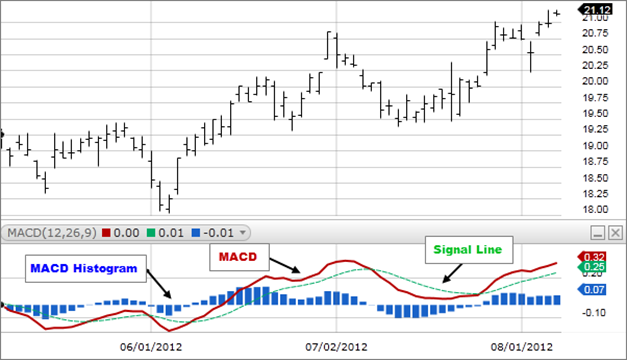
The MACD indicator comprises two lines: the MACD line (blue), which shows the difference between 12 and 26-period EMAs, and the signal line (red), which is a 9-period EMA of the MACD line. There is also a histogram depicting the distance between the MACD and the signal lines.
The zero line of the MACD is critical: crossing above implies an uptrend while crossing below indicates a downtrend. Crossovers between the signal and MACD lines yield buy (above) or sell (below) signals. The MACD, which oscillates near zero, is generally used to indicate overbought or oversold trading circumstances.
How to Use the MACD?
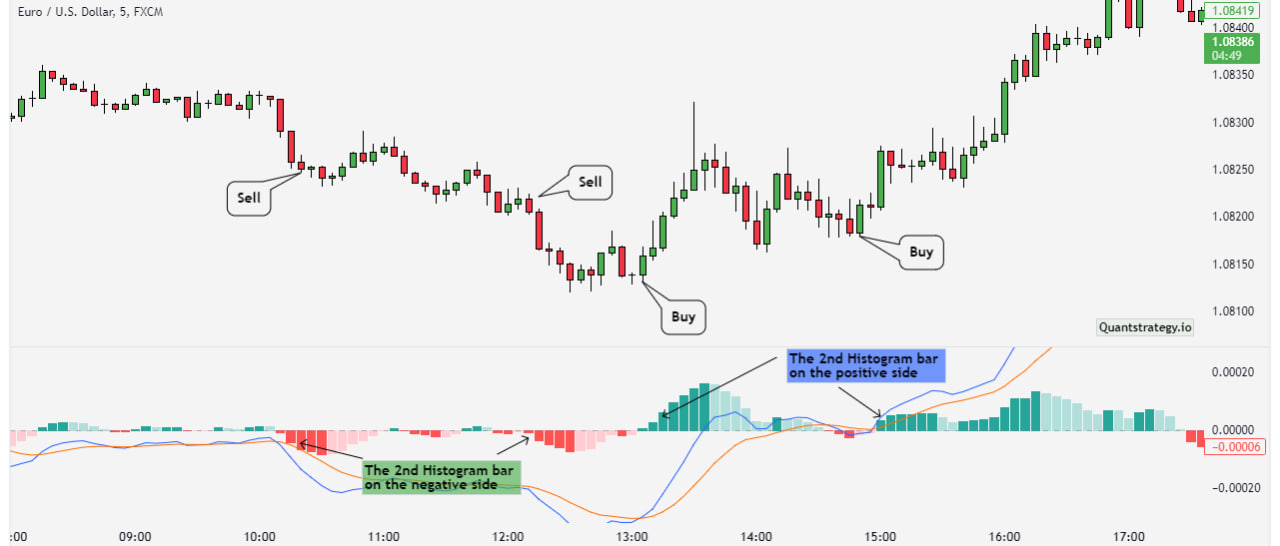
Crossovers are one of the most basic ways to employ the MACD. You get a bullish signal. When two or more histogram bars form on the indicator’s positive side. Your bearish entry is when you see at least two histogram bars developing on the negative side.
You do not need to wait for the two histogram bars to develop before entering. Some aggressive traders enter on the first bar that emerges. The second bar, on the other hand, only confirms the trend.
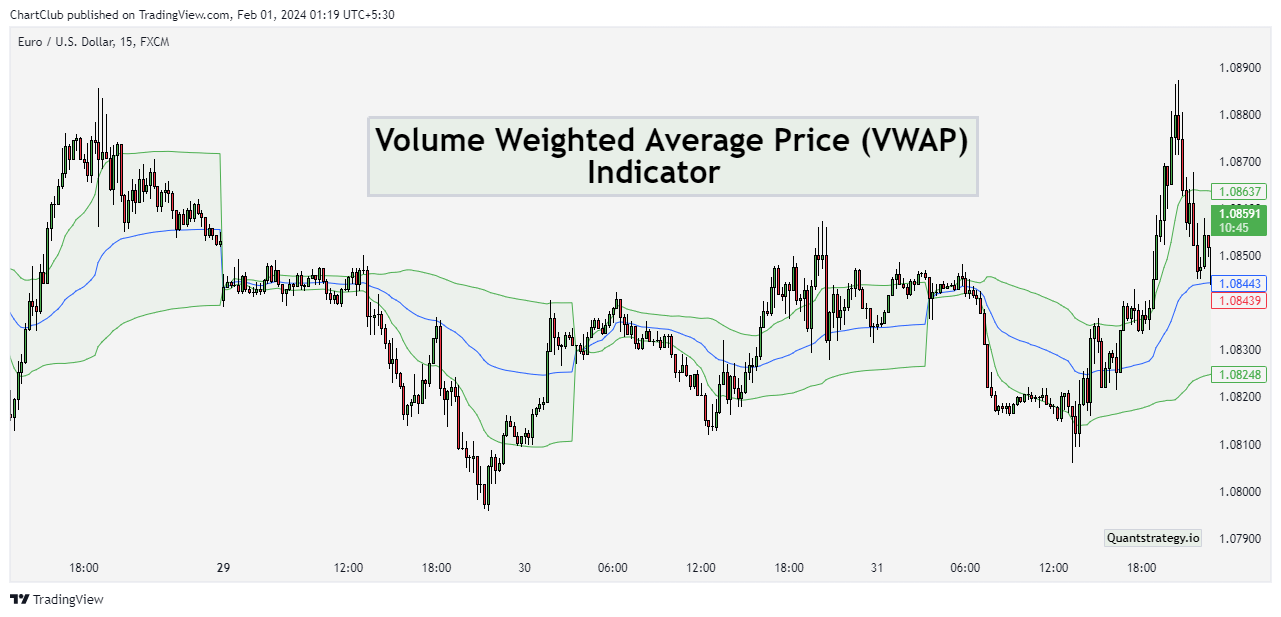
Volume Weighted Average Price (VWAP)
The VWAP is among the greatest scalp trading indicators for all types of short-term traders. In reality, it’s useless on any of the larger time frames because it’s too near to the price to make any sensible reductions on time frames larger than 1 hour. On shorter timescales, however, it’s a potent weapon.
It is calculated by adding the volume of trades in a specific period and dividing it by the total shares traded.
The VWAP has the advantage of recognizing varying markets easily. When the price persistently lingers too close to the VWAP line, the market is most likely a ranging market. If you’re a trend trader, this is your indication to exit the market.
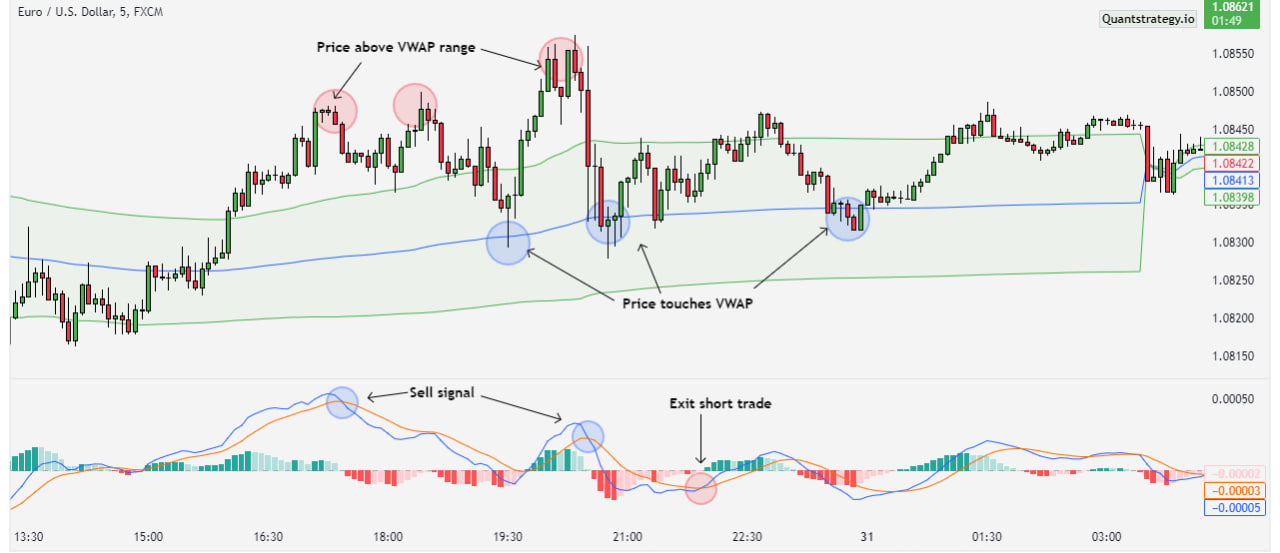
How to Use VWAP?
When the current price is higher than the VWAP line, it may indicate a potential selling opportunity, given the comparatively high price. When the price falls below the VWAP line, it may indicate a good time to buy because the price is low. Monitoring price fluctuations near VWAP throughout the day aids in determining trend strength.
Furthermore, combining VWAP analysis with additional indicators, like MACD, refines entry and exit selections, assisting traders in making sound decisions.
Stochastic Oscillator
This scalp trading tool is a momentum indicator, which compares the closing price of an asset with the price range over a particular period. It is somewhat related to RSI. It generates overbought and oversold indications on a scale of 0-100, with values above 80 indicating overbought situations and values below 20 indicating oversold situations.
The indicator has two lines, one for the daily oscillator value and the other for the three-day SMA. Because price prefers to follow momentum, the place where these lines connect is a possible reversal indicator, indicating a substantial momentum shift. The divergence between the price action and oscillator is also important. For example, if a bearish trend produces a lower low and the oscillator makes a higher low, it indicates fading bearish momentum and a likely bullish reversal.
How to Use the Stochastic Oscillator?
When %K crosses over %D, it can indicate an uptrend and a good purchasing opportunity. In contrast, %K crossing below %D may suggest a downtrend and a potential selling opportunity. Overbought and oversold levels, represented by %K values above 80% or dropping below 20%, can signal possible reversal points. Finally, integrating Stochastic signals with other tools or confirmation strategies, like Bollinger bands, can improve trade choice precision, contributing to more successful risk control and profit maximization.
Conclusion
Scalpers can hardly rely on real-time market liquidity analysis to provide the buy and sell signals required to book several small profits on an ordinary trading day. Fortunately, they can adjust to the new technological world and employ the technical indicators discussed above, which are tailored to very short time frames.
While scalping is not for everyone, its fast-paced nature and brief trade duration make it an appealing option for certain traders. Various indicators, such as Bollinger Bands, MACD, RSI, and others, help scalpers make better decisions. The goal is to mix these tools, ideally only two or three, and thoroughly comprehend their intricacies. The idea is to not rely on any of them alone. Use them in conjunction with other indicators and trading tools. You also don’t have to employ these indicators at their default settings. You can change them to get the best outcomes for your style of trading.
Backtesting and practicing on a demo account with a strategy in mind is always a good idea before risking real money. Remember that good risk management skills are essential for long-term scalping success.


