
The Moving Average (MA) is likely the most extensively used of the hundreds of technical analysis tools available to traders. In fact, it is among the first technical indicators traders turn to when developing a trading strategy. It demonstrates the average price movement over a specific period. It is frequently used to illustrate trends, identify trend reversals, and generate trading signals. It has many types, but Simple Moving Average (SMA) and Exponential Moving Average (EMA) are the two most common.
These moving averages can help market participants make sense of price and better entry and exit decisions. However, how do these two indicators weigh up against one another? In this piece, we’ll discuss their key differences, assisting traders decide which one to employ.
What is the Moving Average in Trading?
Moving averages are used by traders to track price movement over a certain period. A 20-day moving average, for example, computes the average price over the previous 20 days, whereas a 50-day moving average computes the average price over the previous 50 days.
Each moving average indicator is displayed by a line that moves through a chart as the average value alters, smoothing out price fluctuations. The indicator pinpoints trends and trend reversals to alert traders when to buy and sell.
Moving averages are one of the most prominent tools used by day traders to comprehend the movement of stock prices since they provide a layer to any chart research you’re conducting, indicating precisely where the price action is happening.
MAs are commonly utilized in the formation of many other technical indicators, such as the moving average convergence divergence (MACD) indicator and Bollinger Bands.
Trading platforms give chart indications for several types of moving averages, which means you don’t have to compute them manually; simply set the indicator to the number of periods you wish to analyze.
What is a Simple Moving Average (SMA)?
As the name suggests, the Simple Moving Average is the most basic type of Moving Average indicator. It’s a technical analysis tool that calculates the average price over a certain period to indicate the direction of the price of an asset. It aids traders in identifying long-term price trends by smoothing out short-term price fluctuations.
How to Calculate SMA?
A Simple Moving Average (SMA) is exactly what its name suggests: it is the average of a predetermined number of inputs the trader chooses. In the case of an SMA, these inputs will represent closing prices, although it can also examine other data like opening or median prices. If you have ten price inputs (i.e., closing prices from the previous ten days), add them together and divide the total by ten. With each new day, the first day of that 10-day sequence is removed from the calculation and the next day is added.
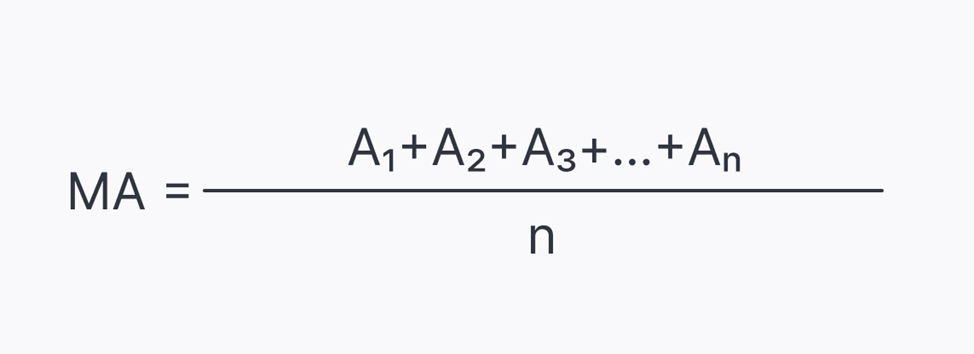
So, SMA is the sum of data points for the particular period divided by the number of periods (n). It provides equal weighting to every data point.
What is the Exponential Moving Average (EMA)?
The Exponential Moving Average is the more advanced cousin to the Simple Moving Average. The formula begins similarly to the SMA but is adjusted so that the most recent data points in the series are given more weight than the older ones. As newer data points age, their weight in the calculation reduces exponentially, hence the name.
EMA lessens the effect of lag caused by using previous price data and can help you recognize a trend earlier, making it a helpful indicator for short-term trades. The main advantage of an EMA is the rapidity with which it responds to price changes, which makes its results more timely and explains why many traders rely on it. But it also demands some caution – it may appear that a trend is developing when it is simply a price increase.
To demonstrate the importance put on recent data, the table below illustrates the percentage of the EMA formed by each of the price bars. For this example, 10 pricing bars are used.
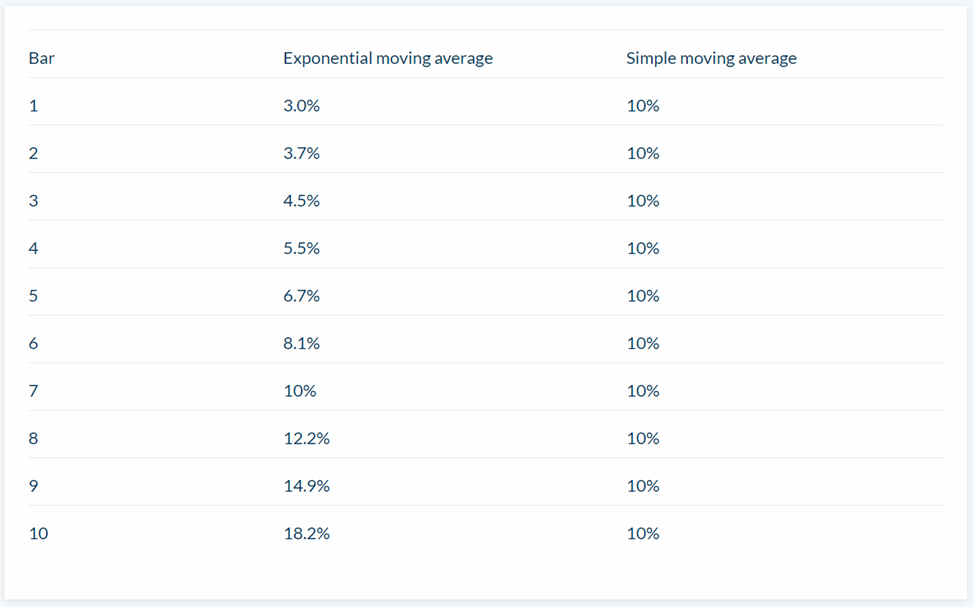
As can be seen, the newest data point, number 10, accounts for 18.2% of the total calculation. The oldest price data, number 1, accounts for only 3% of the total.
How to Calculate EMA?
EMA computation may appear to be difficult, but it is not.
Calculating EMA is far easier than SMA, and as mentioned earlier most charting applications will do it for you. The EMA formula is as follows:
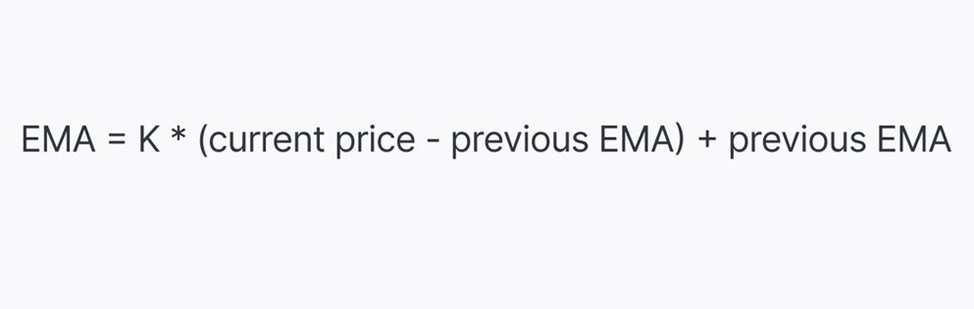
Current EMA = K x (Current Price – Previous EMA) + Previous EMA
Where:
K is the Exponential smoothing constant,
Current EMA is current bar EMA,
Current Price is one of these: bar close, open, high, low, mid-price or typical price,
Previous EMA is previous bar EMA (an SMA is employed for the calculation of the first bar).
The smoothing constant K gives appropriate weight to the recent price and applies the number of periods specified in the moving average.
EMA VS SMA: Key Differences Between SMA and EMA
While both SMA and EMA are commonly deployed in technical analysis, they boast some key differences. Below, we will cover points that highlight their differences.
- Summary: A Simple Moving Average is a slower-moving average usually employed to verify a trend instead of predicting it. On the other hand, Exponential Moving Averages are faster-moving averages that place more weight on recent prices.
- Calculation: Exponential Moving Averages give more weight to recent price data, while Simple Moving Averages give equal weight to all price trends. SMA can be used to calculate EMA, though charts can do this too.
- When to Use: Simple Moving Averages are preferred for long-term trade, whereas Exponential Moving Averages are well-suited for short-term trades in which current price data is considered the most relevant.
- Responsiveness: The slow pace of the Simple Moving Average makes it less responsive to current price changes, while the fast pace of the Exponential Moving Average makes it more responsive to current price changes.
- Line Smoothness: SMA provides a more stable and smoother signal line, whereas EMA can give a more erratic fluctuation since it is more responsive.
- Lag Effect: An Exponential Moving Average results in less lag in buying and selling signals, whereas a Simple Moving Average can result in more lag.
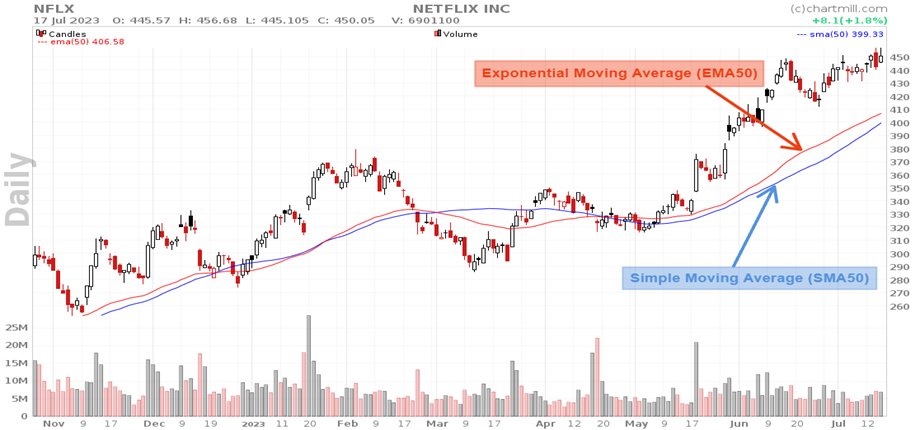
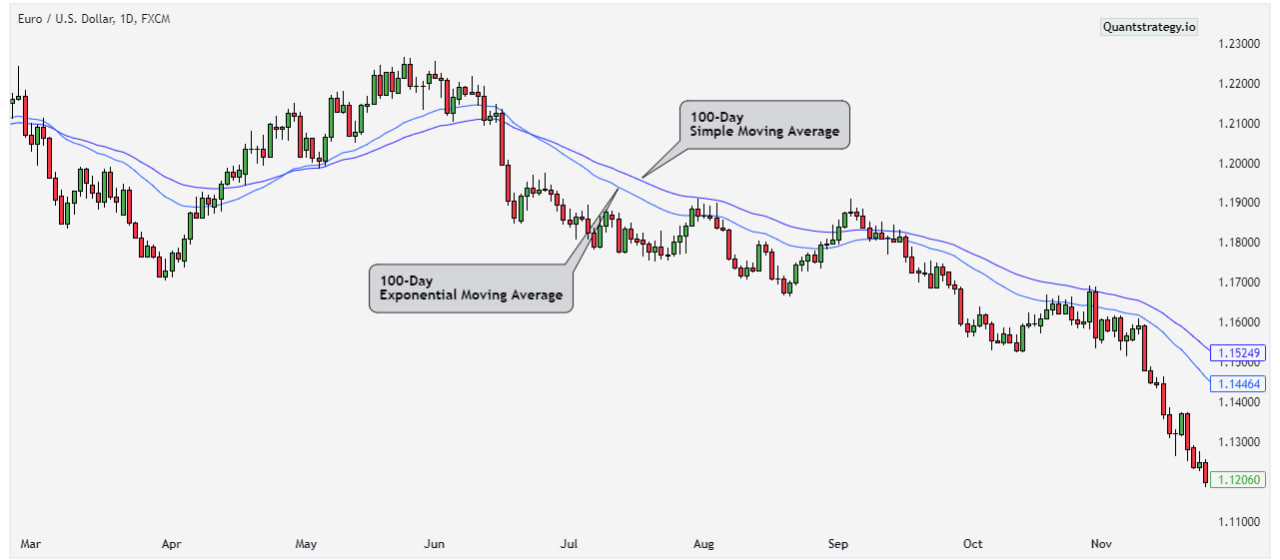
Look at the daily EUR/USD chart below to see how these discrepancies appear on a chart.
Which One is Better for Trading and Investing?
The best technical indicator among these two moving averages for investing and trading is ultimately determined by your unique investment objectives, trading style, and time horizon. One MA is not always superior to the other; they just compute the average price for a certain period in distinct ways.
Both exponential and simple moving averages (EMA and SMA) have advantages and applications. Let us look at the important factors for each:
Long-Term Investing
The Simple Moving Average (SMA) is frequently used by long-term investors who are interested in larger market trends and want to catch substantial price movements over time.
The SMA smooths out short-term price swings, providing a clearer picture of general long-term trends. It is steadier and more predictable, making it suitable for discovering long-term investment prospects.
Short-Term Trading
Short-term traders, like swing traders and day traders, who seek quick market entries and exits, frequently choose the Exponential Moving Average (EMA).
Because it focuses on recent prices, the EMA reacts to price changes more quickly. It delivers more timely indications for short-term trading strategies and can be effective in capturing short-term price movements.
Combining EMA and SMA in One Trading Strategy
Traders and investors frequently combine Exponential Moving Averages and Simple Moving Averages in one trading strategy. This method makes use of the distinct strengths and peculiarities of each moving average.
Traders can develop a more comprehensive and strong trading tactic by combining SMAs with EMAs.
Identifying Trends
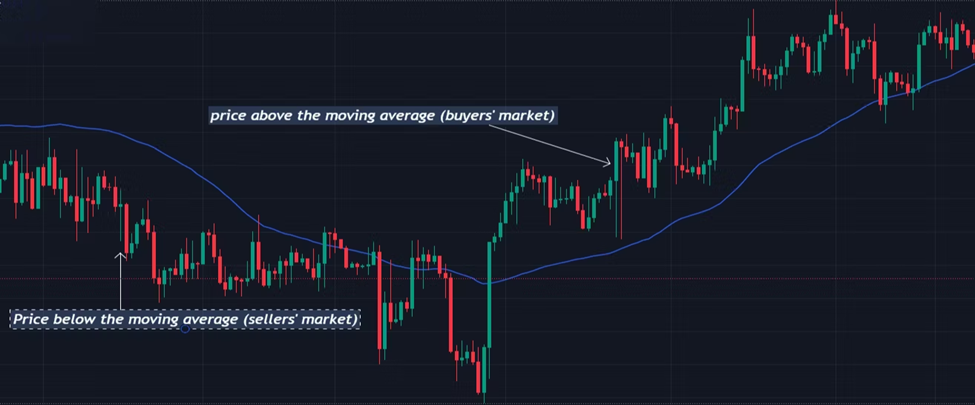
You can determine whether a trend is bullish or bearish by examining if the price is above or below the SMA and EMA indicators. Assume the price is higher than either the Exponential or Simple Moving Average. When the price is above these moving averages, it is in an upward trend; when it is below them, it is in a downward trend.
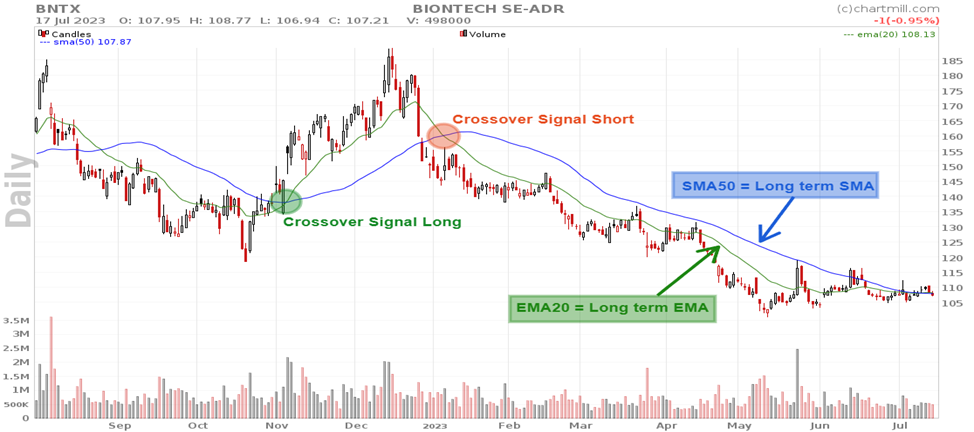
Moving Average Crossovers
Moving Average Crossovers are a prominent trading signal. Whenever a shorter-term EMA passes above or below a longer-term SMA, it can produce buy or sell signals accordingly. This combination of EMAs and SMAs aids in identifying probable trend reversals or confirming the strength of a current trend.
Combining EMAs with SMAs allows traders to leverage the qualities of both moving averages to improve trading decisions, improve timing, and boost the overall success of their trading approach.
Advantages of Simple Moving Average over Exponential Moving Average
SMAs have relatively straightforward computations that include basic arithmetic. On the other hand, the EMA employs a comparatively complex formula, which many traders find difficult to comprehend. However, this distinction may be insignificant for most traders because many trading platforms perform the essential computations automatically. Traders just need to enter the variables that are required.
Since the SMA takes the average pricing throughout the specified time period, it does not react as quickly to price movements as the EMA does. This increases its reliability in spotting longer-term trends. Furthermore, it may be preferable to utilize it in markets that have substantial price volatility to cancel out the noise and generate a smoother line. Besides, SMA is extensively followed, from small traders to major institutions. This increases the reliability of the signals surrounding it.
Advantages of Exponential Moving Average over Simple Moving Average
The EMA is sensitive to unexpected price swings, which day traders may favor while making decisions in rapidly changing volatile markets. Because it reacts swiftly to price swings, it provides more accurate short-term signs for an ongoing trend. This gives you the benefit of quickly evaluating, entering, and exiting trades.
Because the EMA lends greater weight to recent prices than the SMA, you may be able to detect short-term trends and reversals more easily than with the SMA. This makes it appropriate for day trading and scalping tactics. Furthermore, EMA has less latency than SMA, allowing traders to make quicker choices according to current market conditions.
Conclusion
There are different types of moving average indicators. SMAs weigh all price data equally, while EMAs give greater weight to the most recent price.
Incorporating EMAs and SMAs in your trading techniques will render it simple to comprehend market activities, verify trends, enter and exit trades more rapidly, and get buying and selling indications.
However, which moving average should be considered when trading? It all comes down to personal opinion, and there is no harm in plotting both EMA and SMA on trade charts and seeing how they compare.
Find a chart and start experimenting with both of these MAs. Give each a shot while experimenting with various time periods. Finally, you’ll know which one is best for your trading style.