


Technical analysis indicators are used to understand the current situation of the market by easing volatility noise and generating clues regarding potential future moves. Although some indicators focus mainly on volatility and trends, others usually pertain to a trend’s momentum. But there’s a feasible and multifunctional indicator that touches every mentioned aspect – the Donchian Channel.
While this indicator has more common applications in the traditional market, it’s equally appropriate for the crypto market, including futures derivatives. In fact, its founder Richard Donchian, himself was a successful futures trader. This proves that it works exceedingly well for trade speculation or hedging.
Donchian channels are used mostly with candlestick charts as they give a clear and mapped display for interpretation by traders. The candlestick chart in a Donchian Channel reveals important information for decision-making within a trading session.
All in all, we can say that Donchian Channels are volatility indicators that seem like fluctuating channels when plotted on the price action. They primarily help traders visualize the support and resistance levels on the recent lows and highs. As a result, they enable traders to comprehend the volatility and trend of a price effectively.
The best part is that it’s one of the simplest trading channel strategies suitable for newbies to advanced traders. Its versatility renders it applicable to all kinds of markets, including cryptocurrency.
Here’s what it seems like on a chart:

How Do Donchian Channels Work?
You must have heard about Bollinger Bands or Relative Strength Index (RSI), but as told above, Donchian Channel was already developed almost six decades ago by a popular futures trader. The reason behind its creation is mainly to aid traders spot breakouts critically and determine the price volatility of assets.
However, this indicator does a little more than that. It establishes the price trends as well as indicates the strength of the present market greatly– bearish, bullish, or ranging.
The Donchian Channel has three lines in which the upper line shows the highest high of the previous period, and the lower line shows the lowest low of the previous period. While the middle line represents the average of the two prices for that given period. The middle line is calculated by adding the lowest low to the highest high and dividing the result by 2. This means that the wider the two extreme channels are, the more volatile the current market is.
The Donchian channel focuses on finding the relationship between the past and current price of an asset and depicting whether there are bearish or bullish trends within a given time. If the market trades towards the upper line, it indicates bullish energy – a signal for a long position in a financial market. The reverse is true when the market trend moves towards the lower line, which indicates a bearish trend – an indication to make a short position.
However, if the prices are trading towards the middle line, it may signal low volatility of the market, and it may call to employ a hold strategy, pending further signals.
Calculating Donchian Channel Parameters
A separate calculation of the upper, lower, and middle line is involved in the calculation of Donchian Channels. It is as follows:
Upper line = Highest high for the last n periods
Lower line = Lowest low for the last n periods
Middle line = Upper line + Lower line / 2
Depending on the measuring time frame under study, n can be minutes, hours, days, weeks, or months e.g., 20 minutes, 24 hours, 1 week, 20 days, or 4 months.
A typical Donchian Channel uses a 20-day trading period, which is an average number of trading days in a month. However, this can be adjusted as per your trade strategies. To obtain higher sides, you may use maximum numbers in this interval.
Donchian Channel Trading Strategy
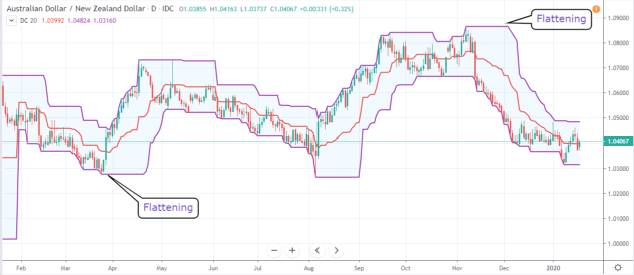
Donchian Channels can be employed in various ways because they have multiple attributes. As mentioned earlier, Donchian Channel has three bands. The lower and upper band are the most important, as they are usually considered to determine the strength of a trend. The picture below, for instance, reveals that in a strong upward trend, the price’s upward shadows touch the upper line of the indicator. The reverse is true for a downward trend where the price usually touches the lower line of the indicator. As a result, this beats the conventional logic that you must short when the upper channel is tested.
Another notable point is the flattening of the higher and upper lines during a trend. The occurrence of this flattening is usually an indication of an onset of reversal. The reversal is often confirmed when an asset’s price moves below or above the middle band.
Donchian Channels VS Bollinger Bands
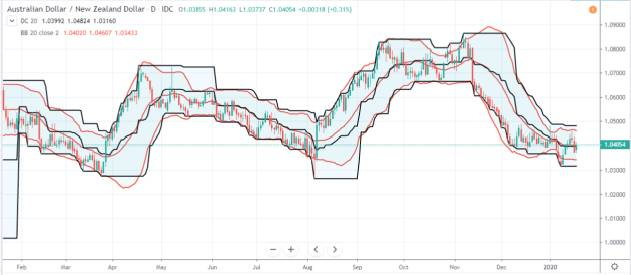
The other popular way of using the Donchian channel is by combining it with Bollinger Bands. Both are similar technical indicators as they help capture the price action within volatile financial markets over a defined period.
The difference lies in the way the two indicators are calculated. While the Donchian lower and upper channels gauge the lowest lows and highest highs, the calculation of Bollinger Bands involves identifying a moving average of a particular period and calculating the standard deviation of that average. The upper band is SMA plus 2 standard deviations and the lower band is SMA minus 2 standard deviations.
The reason behind combining the two indicators is to confirm the formation of a signal. The picture below exhibits 20-period Bollinger Bands (red) and Donchian Channel (black). It clearly shows that an uptrend occurs when the price is close to the upper lines of Bollinger Bands and Donchian Channels.
Donchian Channels VS Keltner Channels
There are a few more price channel indicators, and one such is the Keltner Channel.
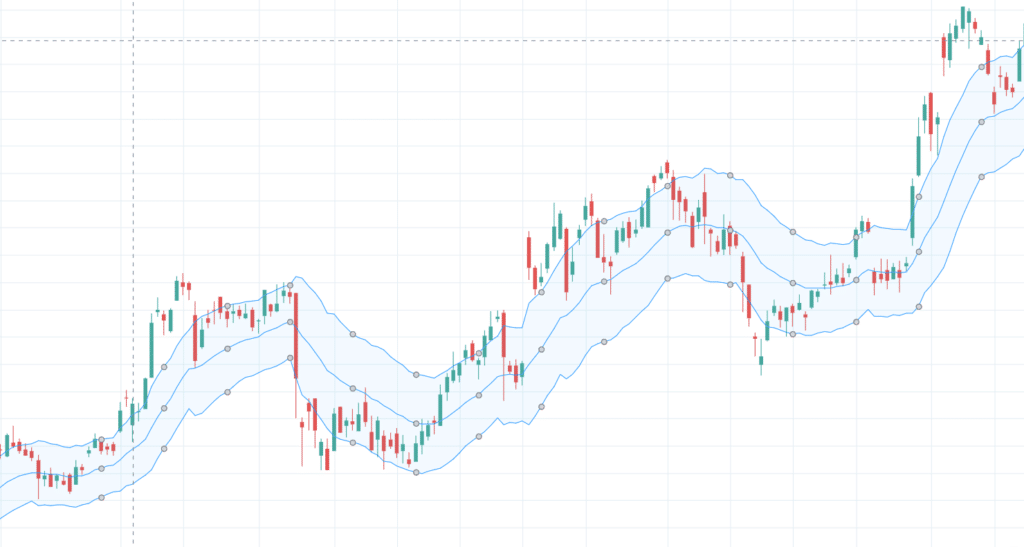
Like the Donchian Channel Indicator, Keltner Channel also has three lines. However, it is calculated in a different way which is as follows:
1. Its middle band is actually an exponential moving average.
2. The lower and upper bands are positioned at a distance, which equals to average true range times 2, below and above the exponential moving average.
You can see that this kind of indicator is quite different from Donchian Channels, which depend only on the highest high and lowest low for the time to chart the upper and lower band.
Yet they may fulfill the same purpose in the trading strategy, though the results can vary somewhat.
Here is an illustration of Keltner Channels.
Double Donchian Channel Trading Strategy
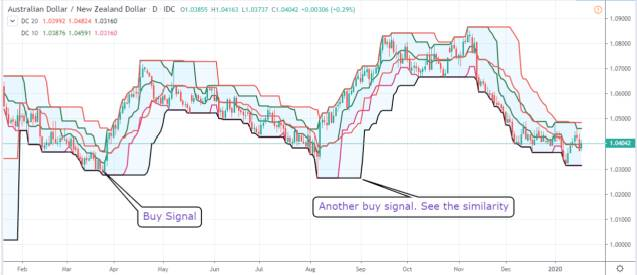
Combining Donchian channels is another common strategy. This resembles the double moving average strategy. The main notion is to include two DC indicators with different periods. One can be with the default option of 20 and the other with a shorter option, such as 10.
The chart will look a little cluttered after applying it as this will have six lines. This can be sorted out by tweaking the colors of the lines.
During this, when an asset’s price shifts above the upper band of the longer period, a buy signal’s usually produced.
The exit signal is made when the exit price falls below the lower band of the line. The reverse is correct for a sell signal, which is made when the price declines a little above the lower band of the longer-dated line.
Breakout Trading Strategy
One of the most preferred ways to use the Donchian Channel is by applying it with the breakout trading strategy. Traders use this strategy to search for signals to open short or long positions.
The signals may be observed each time when the upper channel line moves higher than the preceding high, in which a long position may be considered. Similarly, signals can be seen when the lower line of the channel moves lower than the preceding low, which traders consider going short.
Another way of saying it is that a position is opened when the price breaks below or above the extremes of the Donchian Channel indicator. This suggests that a trend would continue in that specific direction for the moment. The reason is that the upper and lower line act as support and resistance, respectively.
The Middle Line
Apart from the channel’s extremes, the middle line can also provide reasonable signals. For instance, if a cryptocurrency trades close to the middle line without visible deviations toward the lower or upper band, we can assume that the price is experiencing low volatility at the moment, and there’s no clear trend at present. The channel would narrow in such a case.
But if the market trends towards the upper line, it can be sensible to consider a long position and take advantage of the ascending move. If the market inclines towards the lower line, traders may go short.
Ways to Increase Entry Signals with Donchian Channels
- Find High Momentum Breakouts
Not all breakouts can be successful, and there’s no way to generate a perfectly accurate system, however, there are ways to uplift the quality of entry signal with the Donchian channel. The first picture below represents the AAPL chart along with the 20-day Donchian channel. The red (x) marks denote false breakouts, and the green ticks denote successful breakouts.

At first glance, the existence of a considerable amount of false breakouts when the momentum isn’t supporting the move is apparent. To remove low-momentum breakouts that are usually false breakouts, we added the momentum and RSI indicator in the first step. In the successive steps, we showed how other techniques and tools help improve the accuracy of the system.
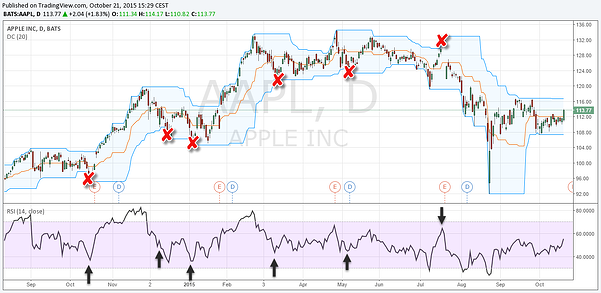
A good note here is that if you’re fading breakouts or a reversal trader, combining RSI and Donchian channels can be a benefit for your trading arsenal. A lack of divergences or momentum can indicate false breakouts if followed by a failed range break.
- Use Moving Average as a Trend Filter
Next, we added a long-term moving average, such as the 100-period moving average in the scenario below. This 100-period moving average is a great filter tool that assists in separating long and short scenarios. You search for breakouts on the upper side only when the price is above this moving average and when the price is below it, you search for short breakouts only.
Many professionals like Marty Schwartz (featured in the Market Wizards series) use moving averages as a directional filter. He mentions the moving average filter to be one of his preferred tools.
The illustration below includes the 100-period moving average as well. There’s a reduction in the number of signals, while there is a significant simultaneous improvement in the quality of signals.
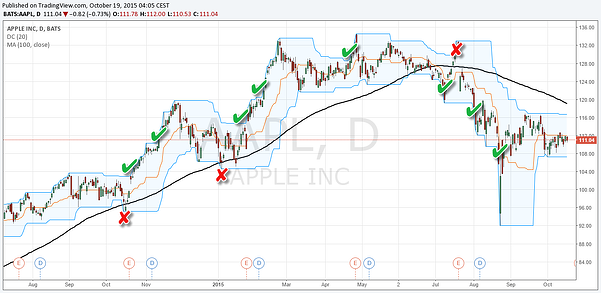
These are only two examples of improving the quality of trade entries by adding trading indicators and tools. The approach underlines the importance of combining trading concepts and tools that support your trading objective and style to remove low-probability entries.
Position Sizing Strategy for Breakout & Trend Following
Since you know how to make the quality of trade signals better now, we can consider discussing position sizing. There’s a particular position sizing strategy for trend-following and breakout traders that can help them improve the quality of their system even further.
‘Scaling in’ is the position sizing strategy that involves entering a fractional amount of the intended position size first, and as the price shifts in your favor, you can add into the winning position and can ideally shift your stop loss in order to protect your so far profits.
This strategy has two main benefits:
- Your position would be relatively small on a fake breakout as you have not reached the full position yet.
- You reach the maximum position size and capitalize fully on winning trades only when the breakout is successful and strong.
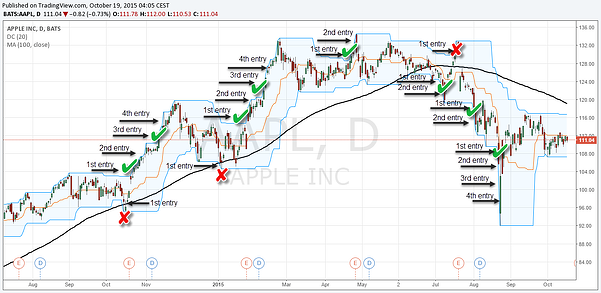
The picture below reveals the AAPL chart and how the effects of the false signals could be reduced by using the scaling in technique. While the successful breakouts often showed long moves and the trader could have scaled in fully, the unsuccessful breakouts failed following the first entry and the loss could be only a factional amount.
Conclusion
Donchian Channel, as developed by Richard Donchian, is one of the indicators that should be known by every trader. Despite its simplicity, it can serve tremendously helpful both for breakout and trend-following traders.
Just remember to be conscious of your market style and build your perspective around your objectives.


